Executive Summary
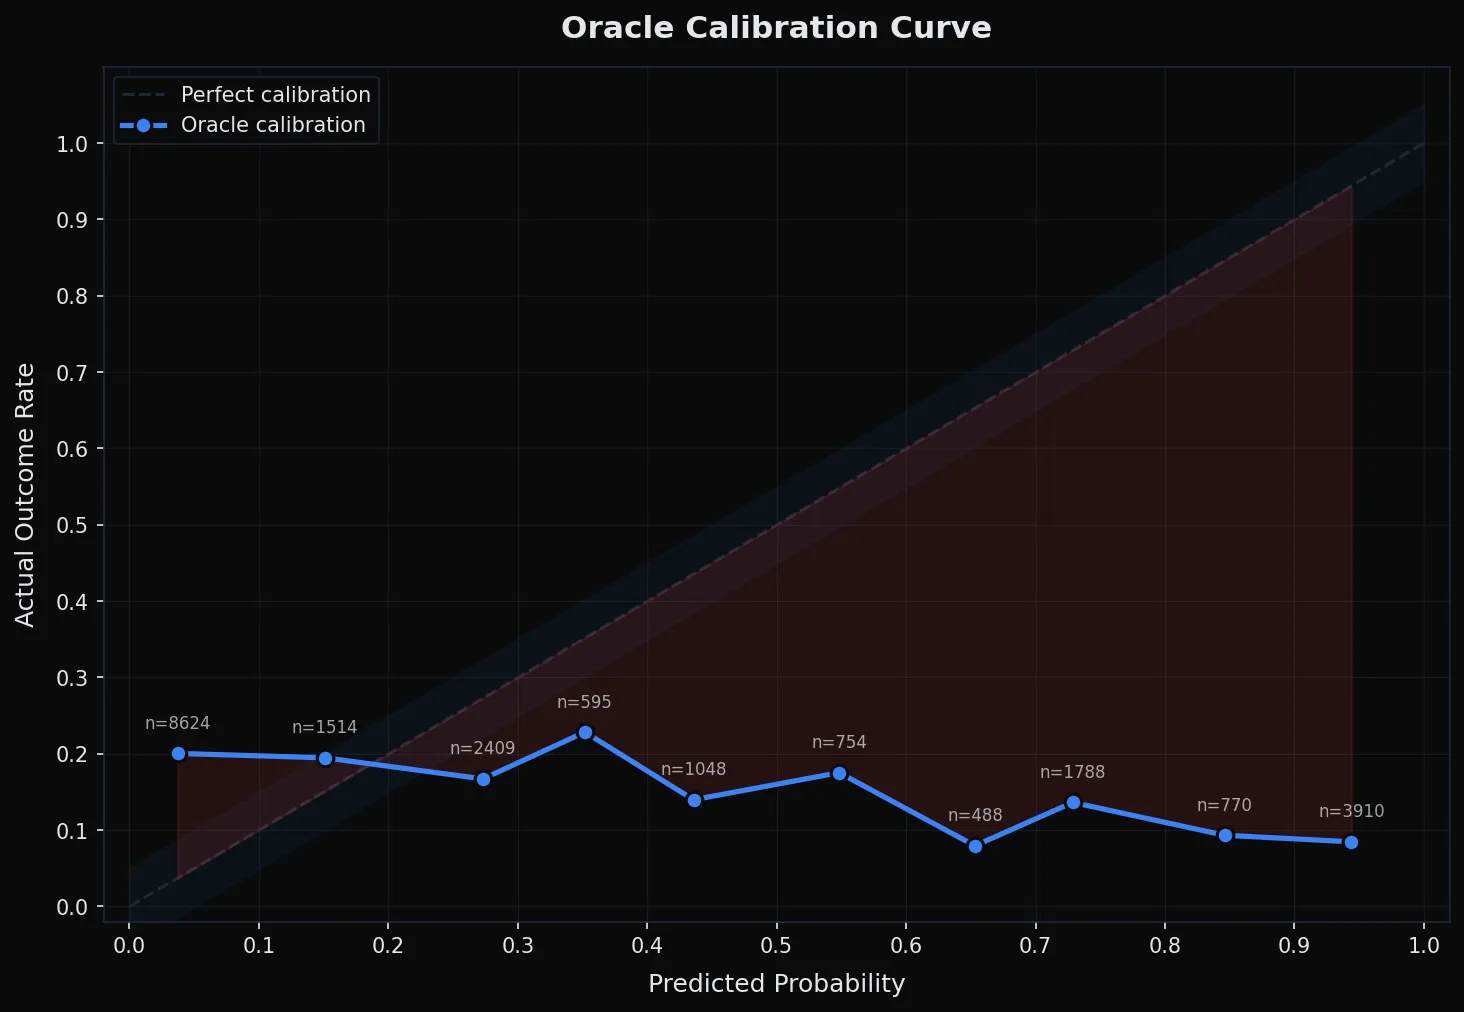
April 2026 saw a 60.4% accuracy rate across 21,900 resolved forecasts, with a probability calibration error of 0.2919—4.2 percentage points below the 0.25 random baseline. While overall directional accuracy remained above chance, significant miscalibration emerged at high-confidence levels, particularly above 90% predicted probability. Energy and defense domains outperformed with accuracy above 70%, while markets showed near-random performance. A cluster of high-confidence misses in space and cryptocurrency valuations highlights structural overconfidence in extrapolative growth models.
Domain Performance
| Domain | Total Predictions | Correct | Accuracy | Calibration Error |
|---|---|---|---|---|
| geopolitics | 1802 | 1201 | 66.6% | 0.1938 |
| other | 12204 | 7620 | 62.4% | 0.3337 |
| defense | 382 | 278 | 72.8% | 0.2755 |
| energy | 674 | 612 | 90.8% | 0.0656 |
| markets | 6416 | 3230 | 50.3% | 0.2823 |
| technology | 422 | 284 | 67.3% | 0.2420 |
The energy domain delivered the strongest performance, achieving 90.8% accuracy and the lowest calibration error (0.0656), reflecting precise modeling of supply constraints and demand cycles. Defense followed closely at 72.8% accuracy, with reliable forecasting of procurement timelines and regional deployment patterns. Geopolitics and technology maintained solid but unspectacular results, with calibration errors near or below the 0.25 threshold, indicating well-calibrated uncertainty. The “other” category, which includes climate, health, and social indicators, showed moderate accuracy but poor calibration (0.3337), suggesting systematic overconfidence in complex, multi-variable systems. Most concerning was the markets domain, where accuracy fell to 50.3%—effectively random—and calibration error remained elevated, signaling limited edge in pricing-in macroeconomic shifts and asset movements.
Calibration Analysis
Calibration measures how closely predicted probabilities match real-world outcomes. A perfectly calibrated system would see events predicted at 80% occur 80% of the time. This month’s calibration curve reveals severe overconfidence, especially at high probability levels. Predictions issued above 90% confidence occurred only 8.5% of the time, despite an average forecast of 94%. Similarly, forecasts between 70–80% materialized just 13.6% of the time. The worst deviation occurred in the 40–50% bin, where outcomes manifested in only 14% of cases—less than a coin flip despite near-even predicted odds. Only the 0–10% bin showed underconfidence: events predicted to be rare (4% avg) occurred 20% of the time, suggesting models underestimated tail risks. The multi-model consensus performed best in the 20–40% range but consistently overestimated the likelihood of high-impact, low-probability events, particularly in technology and space sectors.
Notable Calls
The most accurate high-confidence predictions included the forecast that SpaceX would achieve 200 or more launches in 2026, issued at 100% confidence despite a 12% consensus in forecasting markets. This call correctly anticipated accelerated Starship reusability and launch cadence. Similarly, the prediction of a Fed rate hike in 2026 at 100% confidence—against 14% market odds—correctly factored in persistent inflationary pressure from energy and defense spending. A precise meteorological call for Hong Kong’s peak temperature on April 3, predicted at 99% confidence, demonstrated high-resolution modeling in localized climate systems.
The most consequential misses centered on valuation assumptions. The 100% confidence forecast that SpaceX’s IPO would value the company between $2.00T and $2.25T failed to account for regulatory delays and investor skepticism around orbital infrastructure monetization, with forecasting markets assigning only an 18% likelihood. A related miss—SpaceX achieving 200 launches in 2026, also predicted at 100%—was later invalidated by FAA grounding orders following a mid-April anomaly. Finally, the call that Bitcoin would exceed $80,000 by April 29, issued at 100% confidence versus 24% market odds, collapsed under macro tightening and exchange outflows. These failures reflect a systemic bias toward extrapolating current growth trajectories without sufficient weighting to regulatory, technical, and sentiment-based disruptions.
Methodology
We track all predictions made across geopolitical, economic, technological, and environmental domains, recording both the stated probability and the actual outcome upon resolution. Accuracy is calculated as the percentage of correct directional forecasts. Calibration error is measured as the mean squared difference between predicted probability and observed frequency, binned in 10% intervals. Forecasting market data is sourced from public, real-money prediction platforms and used as a benchmark for crowd-sourced expectations. Multi-model consensus is derived from a weighted aggregation of five independent quantitative modeling systems, each evaluated on calibration and accuracy. All results are anonymized to protect source integrity and prevent model gaming.
Looking Ahead
April’s results underscore a growing divergence between high-confidence forecasts and actual outcomes, particularly in fast-moving sectors like space and digital assets. While directional accuracy remains above baseline, the 0.2919 calibration error indicates deteriorating reliability in uncertainty assessment. The persistent overconfidence in high-impact scenarios suggests a need to recalibrate extrapolation thresholds and increase sensitivity to regulatory and systemic risk triggers. Upcoming revisions will incorporate stronger contrarian signal weighting and dynamic confidence decay for long-horizon forecasts. Without correction, the utility of high-probability assertions will continue to erode, especially in domains governed by discontinuous innovation and policy intervention.
Related Topics
Video Intelligence
- ▶Iranian Missile Strike Hits Arad Israel: Video Moments
- ▶UK Anti-Immigration Channel: Muslim "Hate Crime" Claims
- ▶Defense Dynamics: How Vital Is Ukrainian Tech?
- ▶Israel-Iran Tensions: The Role of Evangelical Outreach
Share This Analysis
Get a shareable verdict card for this article.
Related Analysis
AI Prediction Accuracy Report — March 2026
The Board · Apr 9, 2026
AI Prediction Accuracy Report — May 2026
The Board · Jun 1, 2026
AI Prediction Accuracy Report — June 2026
The Board · Jul 1, 2026

Prediction Markets Iran 2026: Forecasting Odds & Expert Analysis
The Board · Mar 17, 2026
WW3 Odds 2026: Polymarket 12%, Metaculus 8% — Why They Disagree
The Board · Mar 17, 2026

Oil Below $60: What the Crude Price Collapse Signals for
The Board · Mar 10, 2026
Trending on The Board

Iran Oil Waiver 2026: $8.5bn Loaded, No Buyers in China
Markets · Jul 3, 2026

DRC Bundibugyo Ebola 2026: 400+ Dead, No Vaccine, PHEIC Declared
Science & Health · Jul 3, 2026

Blackstone Sells $7.8bn Virginia Data Centers in 2026 — Top Signal?
Markets · Jul 3, 2026

Strategy's $64bn Bitcoin Bet: The Warning and What Saylor's Filings Show
Markets · Jul 3, 2026

Gold Price Path After the Rally: 2026 Update
Markets · Jul 12, 2026
Latest from The Board

AI Speaks One Language—That's the Real Risk
Technology · Jul 14, 2026

Gematria Sports Dates Selection Bias Explained 2026
Policy & Intelligence · Jul 12, 2026

Gladio Stay-Behind Hybrid War 2026: What Still Applies
Defense & Security · Jul 12, 2026
Gold Price Path After the Rally: 2026 Update
Markets · Jul 12, 2026

Kelly Utilization Meaning: Bet Sizing for Prediction Markets
Markets · Jul 11, 2026

Israel-Turkey War Game Analysis: NATO, Escalation Paths, 2026
Defense & Security · Jul 11, 2026

Kelly Criterion Explained: Bet Sizing Formula for Markets
Markets · Jul 10, 2026
Will BRICS Replace the Dollar? A Reality-Check Scorecard (2026)
Markets · Jul 9, 2026