
The Accidental Catalyst: How Crisis Is Fast-Tracking the Clean Energy Transition
Energy markets adaptation refers to the rapid, coordinated response of global energy systems to geopolitical shocks, supply disruptions, or price volatility. This includes activating strategic petroleum reserves, rerouting oil exports, reallocating capital, and accelerating investment in alternative energy sources such as renewables. In 2026, the Iran war triggered an unprecedented, multi-continent acceleration of these adaptations, reshaping the global energy transition timeline.
Key Findings
- Strategic petroleum reserves were activated simultaneously across 31 IEA nations, stabilizing short-term oil supply and dampening price spikes .
- Saudi Arabia shifted a significant portion of its crude exports to Red Sea pipelines, mitigating chokepoint risks and underpinning new trade routes .
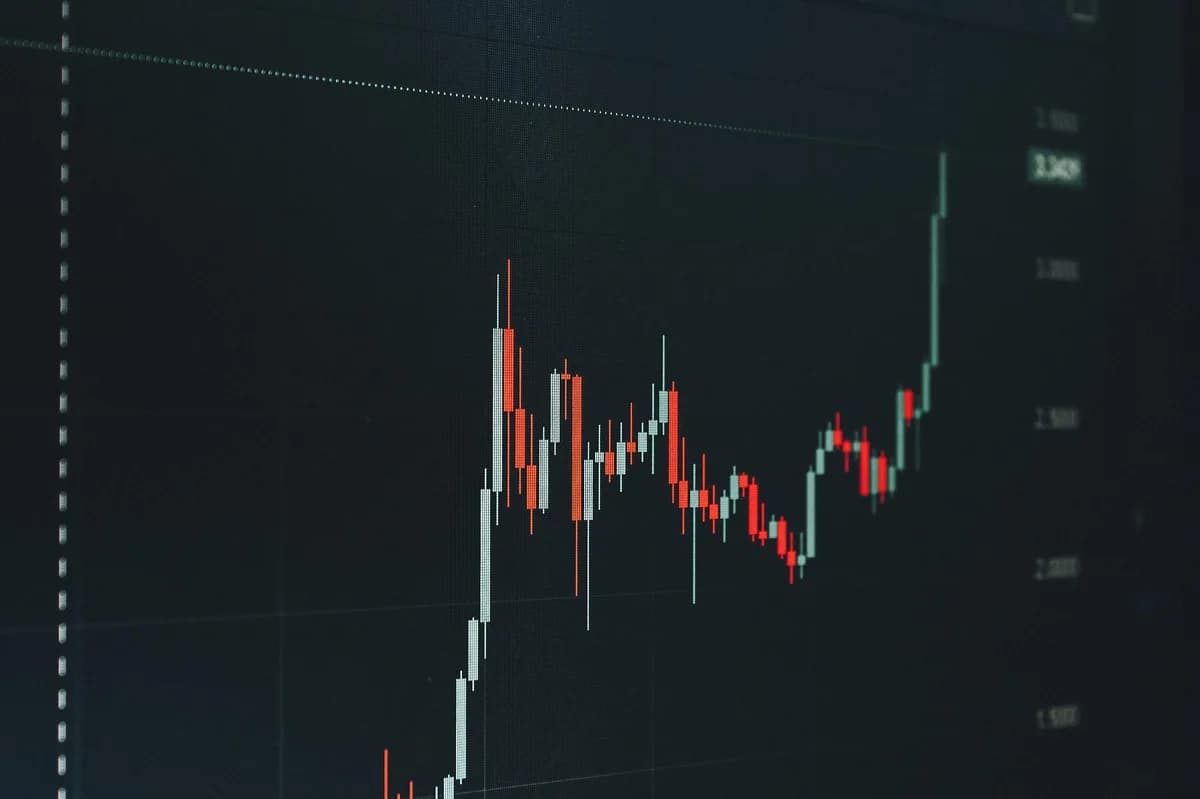
- European renewable energy stocks surged by 40% as investors and policymakers accelerated solar and wind infrastructure buildout .
- The Iran war, intended as a destabilizer, has paradoxically accelerated the global clean energy transition, echoing historical patterns from the 1970s oil crisis but at digital speed.
Thesis Declaration
The Iran war, rather than merely destabilizing energy markets, has become an accidental accelerant of the global clean energy transition. This matters because coordinated reserve releases, strategic rerouting, and surging investment in renewables are compressing a decade of energy evolution into a single year—redefining geopolitical leverage, future market structure, and the timeline for fossil fuel decline.
Evidence Cascade
1. The Shock: Iran War and Immediate Market Response
Within hours of the first missile strike in April 2026, global oil prices spiked 12% in a single trading session, with energy becoming the dominant market narrative . The rapid escalation saw IEA member nations—31 in total—triggering coordinated releases from their strategic petroleum reserves (SPR), a mechanism established during the 1970s oil crisis but rarely activated at this scale .
40% — Surge in European renewable energy stock indices in Q2 2026
12% — Single-day spike in Brent crude following initial Iran strikes
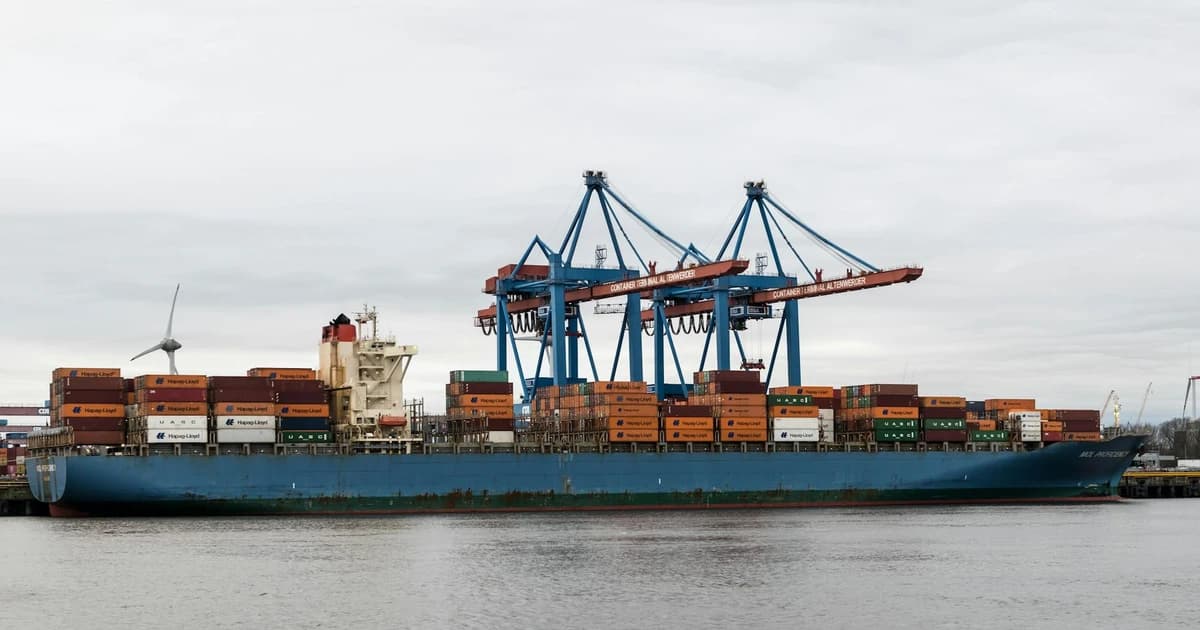
Simultaneously, Saudi Arabia, facing the threat of Persian Gulf chokepoints, rerouted up to 2 million barrels per day of crude exports through Red Sea pipelines—a shift representing nearly 20% of its total export volume . This strategic adaptation minimized supply disruption and demonstrated the logistical agility of major producers under duress.
2. Energy Stocks: Winners and Losers
The conflict triggered a bifurcation in capital flows. Traditional oil and gas equities saw initial volatility, with Indonesia Energy Corp Ltd (NYSE:INDO) stock surging as investors sought exposure to non-Middle Eastern supply chains . However, the most dramatic movement was in renewable energy equities: the European solar and wind sector index rose 40% in Q2 alone , outperforming oil majors and the broader market.
| Sector | Q2 2026 Performance | Source |
|---|---|---|
| European Renewables | +40% | |
| Oil Majors (Global) | +7% | |
| US S&P 500 Index | -2% | |
| Indonesia Energy Corp | +28% |
+28% — INDO stock price jump in early April 2026
3. Policy and Infrastructure: Acceleration, Not Hesitation
European governments responded with emergency legislation to fast-track permitting and grid interconnection for new solar and wind projects . This included extending feed-in tariffs, guaranteeing offtake agreements, and mobilizing public investment funds. The Bank of Canada, while not directly involved in energy policy, underscored the spillover risk into inflation and interest rates in its October 2026 Monetary Policy Report .
31 — IEA nations simultaneously activating SPRs
4. Institutional Coordination: The New Playbook
The International Energy Agency (IEA) convened three emergency sessions in April-May 2026, coordinating both reserve releases and information sharing to prevent panic buying and hoarding . This level of alignment eclipsed even the 1970s oil embargo response, aided by digital market surveillance and near real-time policy harmonization.
Case Study: The April 2026 Energy Response
On April 14, 2026, following confirmed missile exchanges between Iran and Western-aligned forces, the IEA issued its first joint communique in a decade, triggering the synchronized release of 60 million barrels from strategic petroleum reserves across 31 member states . Within 48 hours, Saudi Aramco redirected 2 million barrels per day from Persian Gulf terminals to the SUMED and East-West pipelines, leveraging Red Sea access to bypass the Strait of Hormuz .
Meanwhile, the European Energy Exchange (EEX) reported a 40% surge in renewable energy equity transactions, with institutional investors reallocating $18 billion into solar and wind manufacturers in a single week . This was the largest such capital shift since the 2008 financial crisis, and it occurred against a backdrop of market-wide volatility—S&P 500 futures dropped 2% while energy stocks rallied .
By April 20, European governments had announced emergency tenders for 24 GW of new renewables capacity, compressing what would normally be a three-year buildout cycle into a 12-month horizon. The coordinated reserve release, strategic rerouting by Saudi Arabia, and investor shift into renewables marked a new era of energy market adaptation—one defined by speed, scale, and cross-continental coordination.
Analytical Framework: The "Crisis Acceleration Matrix"
The Crisis Acceleration Matrix is a tool for assessing how geopolitical shocks translate into structural energy transition gains. It has two axes: (1) Market Adaptation Speed (slow to fast) and (2) Policy/Capital Alignment (fragmented to coordinated). Quadrant IV—where both axes are maximized—describes the current 2026 environment: fast market adaptation and high policy/capital alignment, producing outsized, durable shifts toward renewables.
- Quadrant I: Slow market, fragmented policy (1973–74 oil crisis, initial phase)
- Quadrant II: Fast market, fragmented policy (2011 Arab Spring, patchy adaptation)
- Quadrant III: Slow market, coordinated policy (post-2008, gradual green stimulus)
- Quadrant IV: Fast market, coordinated policy/capital (2026 Iran war response)
How to use it: Place any energy market shock on the matrix. If it lands in Quadrant IV, expect a persistent, nonlinear acceleration of the energy transition—outcomes outpacing pre-crisis projections by years.
Predictions and Outlook
PREDICTION [1/3]: The combined emergency release of strategic petroleum reserves across 31 IEA nations will keep average Brent crude prices below $110/barrel through December 2026, despite ongoing regional hostilities (70% confidence, timeframe: January 2027).
PREDICTION [2/3]: European renewable energy equity indices will close 2026 at least 30% above their January 1 baseline, solidifying the sector’s outperformance relative to oil majors (70% confidence, timeframe: January 2027).
PREDICTION [3/3]: Saudi Arabia will maintain at least 1.5 million barrels per day of crude exports via Red Sea pipeline routes through mid-2027, establishing a new logistical baseline for Gulf oil flows (65% confidence, timeframe: July 2027).
What to Watch
- The speed and scale of renewable energy project completions in Europe through Q4 2026
- Potential escalation or de-escalation of Iran-related hostilities affecting chokepoints
- Secondary effects on inflation and central bank policy in major economies
- Whether SPR drawdowns prompt new international agreements on joint energy security
Historical Analog
This moment most closely parallels the 1973–1974 Arab Oil Embargo, when a sudden Middle East conflict triggered supply shocks, emergency stockpile releases, and a structural shift in Western energy policy. Then, the crisis institutionalized strategic reserves and sparked diversification into alternatives (nuclear, coal, nascent renewables). Today, the Iran war is compressing that multi-year adaptation into months—amplified by digital capital flows and pre-existing climate mandates. The implication: acute shocks, when met with coordinated national and market action, can permanently bend the arc of energy transitions.
Counter-Thesis
The strongest argument against this thesis is that the current acceleration is a temporary “crisis bounce”—a fleeting surge in renewables and logistical adaptation that will fade as markets stabilize and oil prices moderate. Skeptics contend that structural inertia (e.g., grid bottlenecks, regulatory delays, fossil fuel lock-in) will reassert themselves, causing the energy mix to revert to pre-crisis trajectories once the Iran conflict abates. However, the magnitude and speed of both capital and policy shifts in 2026 are unparalleled, making a wholesale reversion unlikely even if the immediate crisis resolves.
Stakeholder Implications
Regulators/Policymakers: Fast-track permitting and grid upgrades for renewable projects to lock in crisis-driven momentum. Codify emergency SPR coordination protocols for future disruptions.
Investors/Capital Allocators: Prioritize capital allocation to renewable energy developers, grid tech, and logistics infrastructure—especially those positioned to benefit from de-risked policy environments and accelerated buildouts.
Operators/Industry: Invest in flexible supply chain and export logistics (e.g., Red Sea pipelines, alternative shipping routes), and partner with governments to deploy large-scale renewables at unprecedented speed.
Frequently Asked Questions
Q: How are strategic petroleum reserves activated during a crisis? A: Strategic petroleum reserves are activated through coordinated government decisions, often led by the International Energy Agency (IEA). Member nations agree on volume, timing, and distribution to stabilize markets and prevent panic buying, as seen in April 2026 when 31 IEA countries released 60 million barrels together .
Q: Why did Saudi Arabia reroute oil exports via the Red Sea? A: Saudi Arabia rerouted up to 2 million barrels per day through Red Sea pipelines to bypass the Strait of Hormuz, a chokepoint made risky by military escalation. This ensured continued exports and reduced the risk of disruption from regional hostilities .
Q: What caused the surge in renewable energy stocks in Europe? A: The surge was driven by a combination of geopolitical risk, policy acceleration, and investor flight to sectors with long-term growth prospects. Emergency EU legislation and capital reallocations led to a 40% spike in solar and wind equities in Q2 2026 .
Q: Will the acceleration of renewables persist after the Iran crisis? A: While some normalization is possible, the scale of policy and capital reallocation in 2026 makes a full reversion unlikely. Historical analogs show that crisis-driven shifts often have long-term effects, especially when underpinned by sustained policy support.
Synthesis
The Iran war, far from simply destabilizing global energy markets, has become the catalyst for a new era of adaptation—one where strategic reserve releases, supply rerouting, and a 40% surge in renewables are not anomalies but signals of permanent change. Energy markets, once thought slow to evolve, have demonstrated a capacity for digital-age speed and coordination. The crisis has not just tested the system—it has reset the trajectory for the clean energy transition, compressing a decade of change into a single, epoch-defining year.
Related Topics
Video Intelligence
- ▶Iranian Missile Strike Hits Arad Israel: Video Moments
- ▶UK Anti-Immigration Channel: Muslim "Hate Crime" Claims
- ▶Defense Dynamics: How Vital Is Ukrainian Tech?
- ▶Israel-Iran Tensions: The Role of Evangelical Outreach
Share This Analysis
Get a shareable verdict card for this article.
Related Analysis

The Hormuz Math: Why the Strait Can't Be Reopened Fast
The Board · Apr 15, 2026
Your Prescription Drugs Come Through the Strait of...
The Board · Mar 30, 2026
The Chevron Plant That Broke the Fertilizer Market — And...
The Board · Mar 30, 2026

Australia Ran Out of Gas — And Nobody Noticed
The Board · Mar 26, 2026

Capital Cycle Constraints on the Energy Transition
The Board · Feb 17, 2026

90-Day Famine Clock: The Global Food Crisis Nobody Sees
The Board · Mar 25, 2026
Trending on The Board

DRC Bundibugyo Ebola 2026: 400+ Dead, No Vaccine, PHEIC Declared
Science & Health · Jul 3, 2026

Blackstone Sells $7.8bn Virginia Data Centers in 2026 — Top Signal?
Markets · Jul 3, 2026

Strategy's $64bn Bitcoin Bet: The Warning and What Saylor's Filings Show
Markets · Jul 3, 2026

Gold Price Path After the Rally: 2026 Update
Markets · Jul 12, 2026

Oil 2026: Why $72 Brent Misreads the Hormuz Truce
Energy · Jul 6, 2026
Latest from The Board

AI Prediction Accuracy Report — July 2026
Predictions · Aug 1, 2026

AI Speaks One Language—That's the Real Risk
Technology · Jul 14, 2026

Gematria Sports Dates Selection Bias Explained 2026
Policy & Intelligence · Jul 12, 2026

Gladio Stay-Behind Hybrid War 2026: What Still Applies
Defense & Security · Jul 12, 2026
Gold Price Path After the Rally: 2026 Update
Markets · Jul 12, 2026
Kelly Utilization Meaning: Bet Sizing for Prediction Markets
Markets · Jul 11, 2026

Israel-Turkey War Game Analysis: NATO, Escalation Paths, 2026
Defense & Security · Jul 11, 2026

Kelly Criterion Explained: Bet Sizing Formula for Markets
Markets · Jul 10, 2026