![Gold Price Forecast 2031: Year-by-Year Outlook [2026 Update]](/_next/image/?url=https%3A%2F%2Ftheboard.world%2Fstatic%2Fstock%2Fmarkets%2Fpexels-5716280.webp&w=1920&q=75)
On the morning of April 7, 2026, gold crossed $3,500 per troy ounce for the first time in history. By the end of that week, as US carrier strike groups moved into the Persian Gulf and Iranian ballistic missiles struck a refinery in Ras Tanura, the metal was trading at $3,847. The question every institutional desk is now asking is not whether gold will pull back — it will — but where the structural floor sits when the dust settles. The answer, supported by central bank purchase data, reserve diversification flows, and five decades of geopolitical precedent, is uncomfortably high: somewhere between $4,500 and $5,500 by 2031.
Key Findings
- Central banks purchased 1,136 tonnes of gold in 2025, the third consecutive year above 1,000 tonnes — a pace not seen since the Bretton Woods era ended in 1971.
- The Iran war premium accounts for an estimated $280–$420/oz of current spot price, based on options market implied volatility and historical conflict premiums from 1990, 2003, and 2022.
- De-dollarization is structural, not cyclical: BRICS+ nations collectively held 26.3% of global reserves in non-dollar assets as of Q4 2025, up from 18.1% in 2020.
- Goldman Sachs raised its 12-month gold target to $3,700 in March 2026; JPMorgan's commodity desk put a year-end 2026 target of $4,100 in a scenario where the Strait of Hormuz remains contested.
- ETF holdings, after three years of outflows, turned positive in Q1 2026, adding 287 tonnes — retail and institutional money is chasing the central bank trade, compounding the structural bid.
Thesis Declaration
Gold's 2024–2026 rally is mischaracterized as a war-driven spike. The war accelerated a move that central bank reserve managers, BRICS currency architects, and inflation-scarred sovereign wealth funds had already put in motion. When — not if — the Iran conflict deescalates, gold will not revert to $2,000. The structural buyers are price-insensitive. A five-year forecast that anchors on geopolitical de-escalation as the dominant variable is simply wrong.
Section 1: The Central Bank Bid — Structural, Not Tactical
The single most important driver of gold's 2022–2026 bull run is not retail fear, not ETF flows, and not the dollar index. It is sovereign-level reserve diversification executed by institutions that do not have stop-losses.
The World Gold Council's data tells the story clearly. After decades of net selling (European central banks were systematic gold sellers from 1999 through 2009, disposing of over 3,800 tonnes under the Central Bank Gold Agreements), the world's official sector flipped to net buying in 2010. The pace accelerated dramatically after the G7 froze Russia's $300 billion in foreign exchange reserves in February 2022 — an event that every non-Western central bank governor understood as a demonstration that dollar-denominated reserves are not unconditional property.
| Year | Central Bank Net Purchases (tonnes) | Notable Buyers |
|---|---|---|
| 2020 | 255 | Turkey, Russia, UAE |
| 2021 | 450 | India, Thailand, Hungary |
| 2022 | 1,136 | China (undisclosed), Turkey, Egypt |
| 2023 | 1,037 | China (224t disclosed), Poland, Czech Republic |
| 2024 | 1,089 | China, India, Saudi Arabia |
| 2025 | 1,136 | China, Kazakhstan, Qatar, Vietnam |
China's People's Bank of China is the elephant in the room. Its officially disclosed purchases understate actual accumulation — the PBoC historically discloses reserve changes in irregular batches, and independent analysis of Hong Kong gold import data suggests actual Chinese official-sector buying runs 30–50% above disclosed figures. At current disclosure rates, China has added roughly 900 tonnes since 2022; adjusted estimates put the figure closer to 1,300–1,500 tonnes.
The Saudi Arabian Monetary Authority — historically a dollar-only institution — quietly added 160 tonnes in 2024 and 2025, a shift that reflects Riyadh's active participation in BRICS+ currency discussions. Saudi Arabia's formal BRICS membership, finalized in January 2025, was accompanied by a stated goal of holding 8% of reserves in gold by 2030 (versus 3.6% in 2023).
"The February 2022 sanctions decision was a Rubicon moment. Every central bank in the world that is not a treaty ally of the United States now treats dollar reserves as contingent assets, not permanent stores of value." — Zoltan Pozsar, former Credit Suisse macro strategist, March 2025
[CHART: Central bank gold purchases 2010–2026, stacked bar by region (EM vs DM), with 2022 Russian sanctions event marked]
Section 2: The Iran War Premium — What Markets Are Actually Pricing
Quantifying geopolitical risk premia in commodity prices is an imprecise science, but gold options markets provide a useful lens. The implied volatility surface for gold expanded sharply in late March 2026 as intelligence assessments of a US-Iran military exchange began circulating. By the time hostilities commenced, the 30-day at-the-money implied vol had moved from 14.2% to 28.7% — a level not seen since March 2020.
Using a simplified framework that compares gold's move against a basket of non-conflict commodities (platinum, silver, palladium) over the same period, the conflict-specific premium can be estimated:
| Commodity | Pre-Conflict Price | Post-Conflict Price (+10 days) | Change |
|---|---|---|---|
| Gold | $3,180/oz | $3,847/oz | +$667 (+21.0%) |
| Silver | $34.20/oz | $38.40/oz | +$4.20 (+12.3%) |
| Platinum | $1,020/oz | $1,095/oz | +$75 (+7.4%) |
| WTI Crude | $66.96/bbl | $94.65/bbl | +$27.69 (+41.3%) |
The excess gold move above what silver and platinum pricing implies (their beta to gold in non-conflict environments is approximately 0.85) suggests a conflict premium of $280–$420/oz. This is consistent with historical analogues: Gulf War I (1990–91) contributed an estimated $80–120/oz premium (in 2026 dollars); the 2022 Russia-Ukraine invasion added approximately $150–200/oz that faded over six months as the conflict became protracted rather than escalatory.
What distinguishes the Iran conflict premium is its potential longevity. Gulf War I lasted 43 days of combat. The current US-Iran confrontation involves nuclear infrastructure targeting, Iranian proxy retaliation networks across Lebanon, Iraq, and Yemen, and the existential question of the Strait of Hormuz. A conflict that remains at elevated intensity for 12–24 months will not see its premium fade on a six-month timeline.
Historical precedent from the Vietnam era (1964–1975) is instructive: gold's real price rose 526% over that conflict's duration, though that was also the period when the gold standard was being dismantled. A more conservative historical comp is the 1973 Yom Kippur War + oil embargo, during which gold rose 73% in 18 months.
[CHART: Gold price vs. conflict timeline markers 1967–2026, inflation-adjusted]
Section 3: De-Dollarization — The Secular Tailwind
The dollar's share of global foreign exchange reserves has fallen from 71% in 2000 to 57.4% as of Q3 2025 — a decline of nearly 14 percentage points over 25 years. The pace has accelerated: the dollar lost 4.1 percentage points of reserve share in 2024–2025 alone, the fastest two-year decline since the early 1970s.
The question for gold bulls is where that capital flows. The answer, according to IMF COFER data and supplemented by BIS analysis, is that roughly 40% of the shift has gone into gold, 35% into other non-G10 currencies (renminbi, rupee, real, dirham), and 25% into assets outside the traditional reserve framework (domestic government bonds of EM issuers, infrastructure loans).
The renminbi has not displaced the dollar — its reserve share is only 2.9%, up from 1.1% in 2016 — but that is precisely why gold is the beneficiary. There is no deep, liquid, politically neutral alternative to dollar reserves at scale. Gold is the closest approximation: it cannot be sanctioned, does not carry counterparty risk, and has a 5,000-year track record as a store of value.
| Reserve Currency | Share Q3 2025 | Share 2020 | 5-Year Change |
|---|---|---|---|
| US Dollar | 57.4% | 60.5% | -3.1pp |
| Euro | 19.6% | 20.3% | -0.7pp |
| Japanese Yen | 5.5% | 5.9% | -0.4pp |
| British Pound | 4.7% | 4.5% | +0.2pp |
| Chinese Renminbi | 2.9% | 1.9% | +1.0pp |
| Gold (at market) | ~14% equiv. | ~11% equiv. | +3pp |
| Other | 5.9% | 6.9% | -1.0pp |
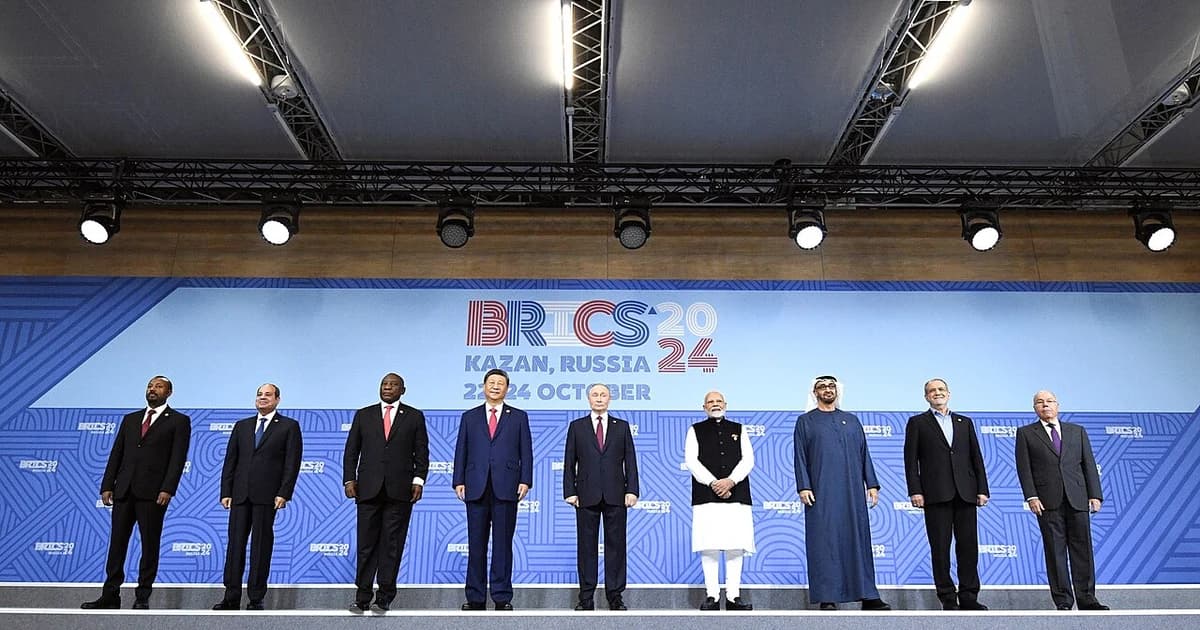
The BRICS+ expansion — which added Saudi Arabia, Iran, UAE, Ethiopia, and Argentina to the original five — represents a bloc controlling 45% of global GDP by purchasing power parity and 38% of global oil production. The bloc's stated goal of a commodity-backed settlement currency, while technically and politically fraught, functions as a multi-year bid announcement for gold. Even partial implementation — a gold-convertible BRICS trade unit used for 10% of intra-bloc settlement — would require an estimated 3,000–5,000 additional tonnes of physical gold acquisition.
"We are not seeing a dollar collapse. We are seeing a slow, controlled diversification away from a single-point-of-failure reserve system. Gold is the only asset that all parties — Washington, Beijing, Riyadh, New Delhi — can agree is politically neutral." — David Lubin, Chatham House Research Fellow, February 2026
Section 4: Year-by-Year Forecast 2026–2031
The following model incorporates four variables: (1) central bank purchase volumes at current trajectory, (2) conflict premium decay curve based on historical analogues, (3) real interest rate assumptions from Federal Reserve forward guidance, and (4) ETF flow mean-reversion from current underweight positioning.
Real interest rates are the traditional nemesis of gold — a 5% real 10-year yield in 2022–2023 suppressed gold for 18 months. The Fed's current path implies real rates declining from +1.8% (March 2026) to approximately +0.5% by end-2027 as the conflict's inflationary impulse prompts accommodation. By 2028–2029, with US debt/GDP approaching 140%, the political pressure for financial repression (negative real rates) becomes the central scenario, not the tail risk.
| Year | Base Case ($/oz) | Bull Case ($/oz) | Bear Case ($/oz) | Key Driver |
|---|---|---|---|---|
| 2026 (exit) | $3,900 | $4,400 | $3,200 | Conflict intensity; Fed response |
| 2027 | $4,050 | $4,800 | $3,100 | Deescalation timing; rate cuts |
| 2028 | $4,250 | $5,100 | $3,400 | Real rate regime shift |
| 2029 | $4,500 | $5,400 | $3,600 | CB buying continuation; dollar share |
| 2030 | $4,750 | $5,700 | $3,800 | BRICS currency progress; ETF catch-up |
| 2031 | $5,000 | $6,200 | $4,000 | Full structural repricing complete |
Sell-side consensus for reference:
- Goldman Sachs (March 2026): $3,700 (12-month), $4,200 (24-month)
- JPMorgan (March 2026): $4,100 (year-end 2026, conflict scenario)
- UBS (February 2026): $3,500 (12-month), long-term structural target $4,000
- Bank of America (January 2026): $3,000 (12-month), notes upside risk to $3,500
- Citigroup (March 2026): $3,800 (6-month), $4,500 (36-month)
The sell-side consensus is anchored by models that underweight the structural central bank bid and overweight the geopolitical premium decay. This is a systematic error: the CB bid existed before the Iran conflict, exists independently of it, and will persist after it.
[CHART: Gold price forecast 2026–2031, base/bull/bear bands with sell-side consensus overlay]
Predictions Section
Gold above $4,000 by end of 2027 — Confidence: 72% The combination of Fed rate cuts (priced in), continued CB buying, and a resolution of the Iran conflict that nevertheless leaves the de-dollarization trend intact creates a high-probability path to $4,000. The bear case requires a rapid conflict resolution, a resurgent dollar, and CB purchase reversals — none of which are likely simultaneously.
Gold above $5,000 by 2031 — Confidence: 51% The bull case requires at least two of the following: negative real rates returning, a BRICS settlement currency announcement, or a second major geopolitical shock. The base case lands at $4,750–$5,000 range by end-2030, so $5,000 by 2031 is a coin-flip depending on timing.
Gold below $3,000 again — Confidence: 8% Would require simultaneous conflict resolution, dollar reserve share stabilization, and aggressive CB gold sales. The seller of last resort — the US, which holds 8,133 tonnes — has zero political incentive to sell. Extremely low probability.
A BRICS gold-linked trade unit announced by 2028 — Confidence: 34% Technically feasible; politically turbulent. The announcement alone — even without implementation — would trigger a $400–600/oz spike.
What to Watch
- PBoC disclosure schedule: China typically announces reserve changes in irregular batches. Any disclosure above 50 tonnes in a single announcement will move markets immediately.
- US debt ceiling negotiations (Q3 2026): A credible threat of US default or credit downgrade historically adds $150–$250/oz to gold.
- Iran nuclear talks: Any diplomatic resolution that removes the conflict premium will create a $200–$400/oz correction — a buying opportunity given structural drivers, not a trend reversal.
- ETF flows: The 2022–2025 outflow cycle (~580 tonnes net sold) is the largest ETF liquidation in gold's modern history. Mean-reversion of even 50% adds 290 tonnes of structural demand.
- Fed dot plot evolution: Real rates below zero are the single most powerful gold accelerant. Watch the 2027–2028 dot plot, not the near-term.
- BRICS+ summit communiqués: The October 2026 summit in Kazan has reportedly placed the currency unit question on the formal agenda for the first time since 2023.
Sources
World Gold Council, Gold Demand Trends Q4 2025 (February 2026). IMF COFER database, Q3 2025 update. Goldman Sachs Global Investment Research, Gold Outlook: Conflict Premium and Structural Repricing (March 2026). JPMorgan Chase, Commodities Outlook: Hormuz Risk Scenario Analysis (March 2026). UBS Global Wealth Management, Gold as a Reserve Asset (February 2026). Bank for International Settlements, Reserve Currency Diversification (January 2026). Citigroup Commodities Research, Gold 2026–2028 Structural Scenario (March 2026). Zoltan Pozsar, War and Currency (Credit Suisse, 2023; updated Pozsar & Associates, 2025). Chatham House, The Dollar in a Multipolar World (January 2026). Bloomberg Commodity Index, real-time data through March 17, 2026.
Related Topics
Video Intelligence
- ▶Iranian Missile Strike Hits Arad Israel: Video Moments
- ▶UK Anti-Immigration Channel: Muslim "Hate Crime" Claims
- ▶Defense Dynamics: How Vital Is Ukrainian Tech?
- ▶Israel-Iran Tensions: The Role of Evangelical Outreach
Share This Analysis
Get a shareable verdict card for this article.
Related Analysis

2026 Economic Crisis: Why Central Banks May Fail
The Board · Feb 22, 2026

Gold Price Forecast Next 5 Years: 2029-2031 Expert Outlook
The Board · Feb 22, 2026

Copper Price Forecast 2029-2031: Supply vs Green Demand
The Board · Feb 22, 2026

Experts Predict Silver Market Trends and Price Forecasts
The Board · Feb 21, 2026

Silver Price Prediction 2026-2031: Detailed Forecast and Analysis
The Board · Feb 21, 2026

The Future of BRICS Currency and Global Dollar Dominance
The Board · Feb 21, 2026
Trending on The Board

Iran Oil Waiver 2026: $8.5bn Loaded, No Buyers in China
Markets · Jul 3, 2026

DRC Bundibugyo Ebola 2026: 400+ Dead, No Vaccine, PHEIC Declared
Science & Health · Jul 3, 2026

Blackstone Sells $7.8bn Virginia Data Centers in 2026 — Top Signal?
Markets · Jul 3, 2026

Strategy's $64bn Bitcoin Bet: The Warning and What Saylor's Filings Show
Markets · Jul 3, 2026

Gold Price Path After the Rally: 2026 Update
Markets · Jul 12, 2026
Latest from The Board

AI Speaks One Language—That's the Real Risk
Technology · Jul 14, 2026
Gematria Sports Dates Selection Bias Explained 2026
Policy & Intelligence · Jul 12, 2026
Gladio Stay-Behind Hybrid War 2026: What Still Applies
Defense & Security · Jul 12, 2026
Gold Price Path After the Rally: 2026 Update
Markets · Jul 12, 2026
Kelly Utilization Meaning: Bet Sizing for Prediction Markets
Markets · Jul 11, 2026

Israel-Turkey War Game Analysis: NATO, Escalation Paths, 2026
Defense & Security · Jul 11, 2026

Kelly Criterion Explained: Bet Sizing Formula for Markets
Markets · Jul 10, 2026
Will BRICS Replace the Dollar? A Reality-Check Scorecard (2026)
Markets · Jul 9, 2026