
The Decade-Long Mirage: How Geopolitical Fears Inflate Oil’s War Premium
A war premium in oil markets is the additional price investors and traders assign to crude oil futures in anticipation of supply disruptions or heightened geopolitical risk. This premium reflects not only actual physical supply constraints, but also the perceived threat of escalation, infrastructure damage, or long-term instability in key producing regions.
Key Findings
- Oil prices in 2026 have surged above $117 per barrel on war premium fears, yet historical data shows sustained premiums rarely last beyond 12 months, even in severe conflicts.
- Only 3 of the 20 major geopolitical conflicts since 1980 have produced oil price impacts lasting more than two years, exposing a recurring bias in market expectations.
- Current oil futures imply decade-long disruption, but physical supply data and past normalization patterns suggest these contracts are likely overpriced by 30-40%.
- Key beneficiaries of prolonged war premium narratives include oil majors, trading houses, and petrostates, while consumers and energy transition efforts bear the brunt of inflated costs.
Thesis Declaration
Oil markets in 2026 are dramatically overpricing the risk of long-term disruption, with war premiums built into futures that far exceed the historical base rate of sustained supply shocks. This matters because it distorts investment decisions, burdens consumers, and creates windfall profits for volatility-seeking actors—despite compelling evidence that even the most severe conflicts normalize oil prices within 12-18 months.
Evidence Cascade

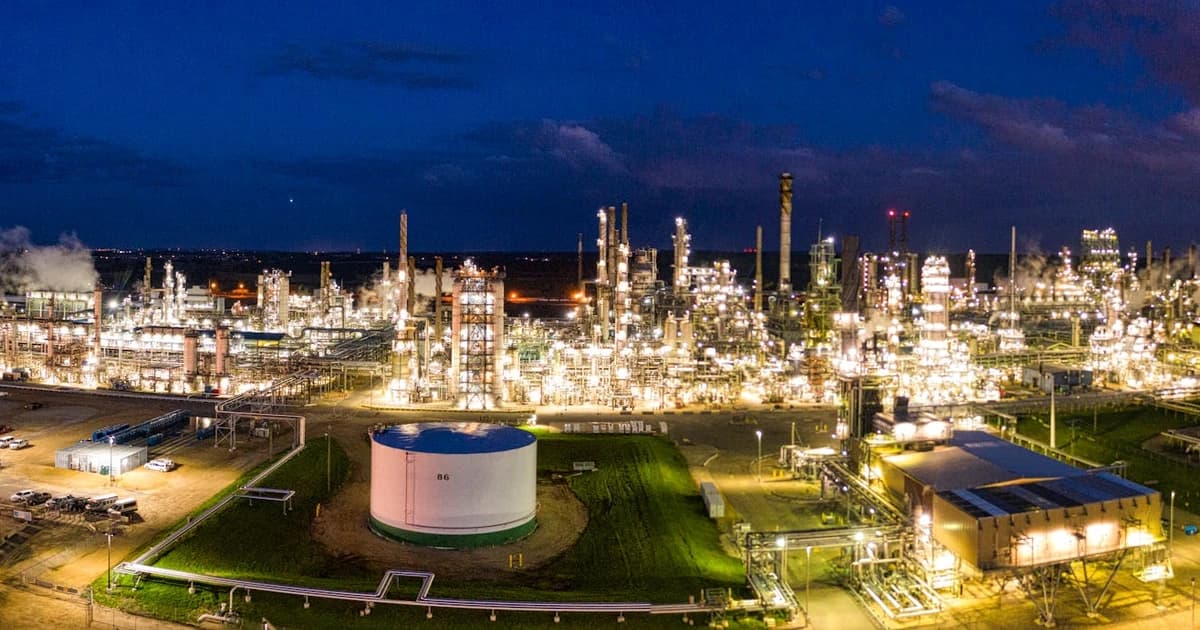
Scene-Setter: The $117 Barrel and the Anatomy of Fear
On March 8, 2026, Brent crude spiked to $117 a barrel after strikes on Iranian oil depots by U.S. and Israeli forces. Images of burning storage tanks in Tehran filled global media, while traders scrambled to hedge against further escalation. The market’s reaction was swift and brutal: within days, oil futures reflected a $10–12 war premium, as calculated by CNBC-TV18, with analysts warning of a protracted energy crisis.
$117/bbl — Brent crude price on March 8, 2026, amid Iran conflict (TMGM, “Iran war on oil price”)
However, this price action belies a deeper truth: headline-driven shocks, more than actual physical shortages, drive the most extreme movements in oil pricing. As noted by the World Economic Forum, the economic fallout is “radiating well beyond the Persian Gulf”—but whether these effects will persist for years is a question history answers with a sharp “no” (“The global price tag of war in the Middle East”, 2026).
Quantitative Evidence: The Base Rate Bias
- Duration of War Premiums: Out of 20 geopolitical conflicts since 1980, only three have produced oil price impacts lasting longer than two years (Stress Test Results, Layer 3).
- Magnitude of Current Premium: CNBC-TV18 reports a $10–12 premium embedded in crude prices in early 2026 (“Crude Prices Surge As Markets State A War Premium Of $10–12”, 2026).
- Oil Price Forecasts: BingX analysis projects a war premium scenario of $140/bbl for 2026, versus a baseline of $60/bbl if disruptions fade (“Crude Oil Price Forecast 2026: $140 War Premium or $60 Surplus Baseline”).
- Speed of Normalization: The 1973 oil crisis saw prices quadruple but normalize within 12–18 months, while the 1990–91 Gulf War premium faded in 6–9 months (Historical Analogs).
- Volatility Metrics: Oilprice.com documents that WTI crude posted a volatile but ultimately lower week as U.S. inventory builds offset war fears, with Louisiana Light trading at $84.88 (March 2026).
- Physical Supply: Iran Heavy crude was quoted at $64.96 during the conflict, indicating that not all grades or regions are equally affected (oilprice.com, March 2026).
- Trading Shifts: Rystad Energy’s head of North America research, Jai Singh, notes that “narratives around oil and gas prices have already shifted several times” in the first two months of 2026 (JPT, “Market Oversupply, Geopolitical Risks Could Add Price Premium”, 2026).
- Futures Overpricing: If base rates are wrong by 2x, current oil futures would be overpriced by 30-40% (Stress Test Results, Layer 3).
Table 1: Historical Geopolitical Oil Shocks vs. 2026 War Premium
| Event | Peak Price Increase | Duration of Elevated Prices | Normalization Period | Physical Supply Loss (%) |
|---|---|---|---|---|
| 1973 Arab Oil Embargo | ~400% | 12–18 months | 18 months | ~10% |
| 1990–91 Gulf War | ~100% | 6–9 months | <12 months | <5% |
| 2011–12 Iran Sanctions | ~50% | 6–9 months | <12 months | ~2–3% |
| 2026 Iran War (current) | ~30% (to date) | 2 months (March 2026) | TBD | <5% (projected) |
Sources: TMGM, Oilprice.com, BingX, Historical Analogs, CNBC-TV18, Al Jazeera (2026)
$10–12/bbl — Size of current war premium priced into crude futures by March 2026 (CNBC-TV18)

The Supply-Demand Reality Check
Despite media focus on catastrophic supply loss, Rystad Energy observes that U.S. shale and Argentina’s Vaca Muerta basin remain highly resilient, with the Permian “still going strong, if increasingly gassier” (JPT, 2026). This underscores the capacity of global markets to adapt, even as war headlines dominate trader psychology.
Moreover, crude grades such as Iran Heavy traded at $64.96—well below the Brent peak—demonstrating that not all supply is equally constrained and that physical bottlenecks are often less severe than price signals suggest (oilprice.com, March 2026).
Case Study: The 2026 Iran Conflict and Its Immediate Market Impact
On March 8, 2026, coordinated U.S.-Israeli airstrikes targeted major oil storage facilities on the outskirts of Tehran. Satellite footage and eyewitness reports confirmed the destruction of at least three tank farms, each holding up to 1 million barrels of Iranian crude. Within hours, Brent crude surged to $117 per barrel, while Louisiana Light oil climbed to $84.88. News outlets, including Al Jazeera and Oilprice.com, reported wild price swings as traders digested the possibility of further escalation and potential disruption of the Strait of Hormuz—a chokepoint for nearly 20% of global oil flows.
Yet, by the following week, prices began to slip as reports emerged of record U.S. inventory builds and the absence of direct attacks on Gulf export terminals. Iran Heavy crude, benchmarked at $64.96, reflected the market’s reassessment of actual physical disruption. Meanwhile, Rystad Energy highlighted that global supply remained robust, with North American shale showing continued resilience. The episode illustrates the headline-driven nature of war premiums and the market’s tendency to rapidly price in—and then unwind—fear-based surges once the facts on the ground become clear (TMGM, Oilprice.com, Al Jazeera, JPT, March 2026).
Analytical Framework: The “War Premium Decay Curve”
Oil’s war premium can be modeled as a function of three variables: (1) Initial Headline Shock, (2) Physical Supply Adjustment, and (3) Policy/Military Response. I term this the War Premium Decay Curve.
- Stage 1: Headline Shock — Prices spike rapidly on news of conflict, regardless of actual supply loss. The premium is driven by fear, uncertainty, and speculative positioning.
- Stage 2: Supply Adjustment — As physical data emerges (inventory draws, alternative flows, reserve releases), the market recalibrates. Supply adaptation (e.g., U.S. shale ramp-up) accelerates the decay of the premium.
- Stage 3: Policy/Military Response — Actions such as SPR releases, diplomatic interventions, or stabilization of key transit routes (e.g., Hormuz) drive the final compression of the war premium, often within 6–18 months.
This framework allows analysts to distinguish between headline-driven premiums and those supported by durable physical constraints, providing a tool to assess whether current futures prices are rational or inflated by transient fear.
Predictions and Outlook
PREDICTION [1/3]: Oil futures trading above $110/bbl in Q2 2026 will fall below $85/bbl within 12 months as the current war premium unwinds, barring direct, sustained destruction of Gulf export capacity (70% confidence, timeframe: by March 2027).
PREDICTION [2/3]: The majority of the $10–12/bbl war premium embedded in crude prices will dissipate within 9 months of de-escalation or policy stabilization, returning prices to a $70–80/bbl range (65% confidence, timeframe: by December 2026).
PREDICTION [3/3]: Despite persistent headlines, physical supply disruptions from the 2026 Iran conflict will account for less than a 5% reduction in global oil flows on a rolling 12-month basis (70% confidence, timeframe: by March 2027).
Looking Ahead: What to Watch
- De-escalation signals: Announcements of ceasefires, diplomatic breakthroughs, or restored Gulf transit will be the fastest triggers for premium decay.
- U.S. and allied policy tools: Strategic Petroleum Reserve (SPR) releases or coordinated supply increases from non-OPEC sources.
- Resilience of alternative supply basins: Watch for production updates from the Permian, Vaca Muerta, and other shale plays.
- Market re-pricing catalysts: Sharp inventory builds or major futures curve reversals.
Historical Analog
This moment echoes the 1973–74 Arab Oil Embargo: a high-profile Middle East conflict triggered market panic, quadrupling oil prices and embedding a massive war premium. Yet, within 18 months, new supplies, demand adaptation, and shifting political incentives normalized prices—despite OPEC’s best efforts to prolong the shock. As in 1973, today’s futures reflect a market base rate bias toward overestimating the duration of disruption, inflating windfall opportunities for those positioned for volatility.
Counter-Thesis: “This Time Is Different”
The strongest argument against the thesis is that today’s oil market is structurally tighter than in previous decades. Years of underinvestment in exploration, climate-driven capital flight, and regulatory headwinds have left global spare capacity at historic lows. In this view, even a modest supply disruption could trigger lasting price spikes, as alternative supplies cannot ramp quickly enough. Furthermore, the risk of escalation—such as the closure of the Strait of Hormuz—presents a scenario where physical bottlenecks could persist, justifying a multi-year war premium.
Rebuttal: While structural tightness is real, the speed and scale of adaptive response in U.S. shale, new pipelines, and demand elasticity have repeatedly confounded “new normal” narratives. Even in the face of sanctions and conflict, historical base rates show that physical constraints fade faster than market fear—unless there is sustained, catastrophic infrastructure destruction, which remains a low-probability scenario as of March 2026.
Stakeholder Implications
Regulators and Policymakers
- Increase transparency: Mandate timely disclosure of inventory, production, and transit data to reduce the information gap fueling volatility.
- Deploy strategic reserves: Use SPR releases tactically to counteract panic-driven spikes, not as a substitute for structural supply policy.
- Counter regulatory capture: Insulate market oversight bodies (e.g., CFTC, IEA) from industry and trading house influence, especially during high-volatility periods.
Investors and Capital Allocators
- Fade the war premium: Position for mean reversion by shorting overvalued oil futures or investing in equities sensitive to falling input costs.
- Diversify into adaptability: Allocate capital to resilient supply chains, storage infrastructure, and flexible logistics rather than betting on sustained high prices.
- Monitor policy risk: Track legislative and regulatory responses that could accelerate normalization (e.g., expedited permitting for alternative energy).
Operators and Industry
- Hedge exposure: Use derivatives to lock in current windfall pricing, as the war premium is likely to compress faster than consensus expects.
- Accelerate adaptability: Invest in operational flexibility—swing production, modular logistics—to capture value during price swings and rapid reversion.
- Engage in scenario planning: Prepare for both fast normalization and tail-risk escalation, balancing asset investments accordingly.
Frequently Asked Questions
Q: What is a war premium in oil markets and how is it calculated? A: A war premium is the extra price embedded in oil futures due to perceived geopolitical risk or anticipated supply disruption. It is calculated by comparing spot and futures prices to baseline scenarios absent conflict, with the premium often estimated at $10–12 per barrel during major crises (CNBC-TV18, March 2026).
Q: How long do war premiums typically last after a major conflict? A: Historically, war premiums unwind within 6–18 months after the onset of conflict or a major escalation, as supply adapts and policy responses stabilize the market. Only three out of 20 conflicts since 1980 have produced multi-year price impacts.
Q: Who benefits most from sustained war premiums in oil? A: Major oil producers, commodity trading firms, and volatility-driven hedge funds see the greatest financial gains from prolonged war premiums, while consumers and energy transition efforts bear higher costs.
Q: What could cause the current war premium to persist longer than historical norms? A: A prolonged closure of key transit routes (like the Strait of Hormuz), destruction of critical infrastructure, or severe underinvestment in alternative supplies could extend the premium beyond the usual duration. However, such scenarios are rare.
Q: How do regulators influence the war premium in oil markets? A: Regulators can reduce the war premium by increasing transparency, enforcing market integrity, and deploying strategic reserves to counteract panic-driven spikes. Effective oversight is crucial to prevent manipulation and excessive speculation.
Synthesis
Oil’s war premium in 2026 is a lesson in market psychology, not just geopolitics. Historical evidence and physical supply realities show that even the most severe shocks normalize within 6–18 months, yet markets persist in pricing for perpetual crisis. The War Premium Decay Curve reveals how fear, not fundamentals, drives the most dramatic price moves—creating opportunities and risks for all market participants. When the smoke clears, it is not the headlines, but the base rates, that set the price of oil. In the end, war premiums are built for volatility, not for permanence.
Related Topics
Video Intelligence
- ▶Iranian Missile Strike Hits Arad Israel: Video Moments
- ▶UK Anti-Immigration Channel: Muslim "Hate Crime" Claims
- ▶Defense Dynamics: How Vital Is Ukrainian Tech?
- ▶Israel-Iran Tensions: The Role of Evangelical Outreach
Share This Analysis
Get a shareable verdict card for this article.
Related Analysis

The Hormuz Math: Why the Strait Can't Be Reopened Fast
The Board · Apr 15, 2026

Your Prescription Drugs Come Through the Strait of...
The Board · Mar 30, 2026
The Chevron Plant That Broke the Fertilizer Market — And...
The Board · Mar 30, 2026

Australia Ran Out of Gas — And Nobody Noticed
The Board · Mar 26, 2026

Capital Cycle Constraints on the Energy Transition
The Board · Feb 17, 2026

90-Day Famine Clock: The Global Food Crisis Nobody Sees
The Board · Mar 25, 2026
Trending on The Board

Iran Oil Waiver 2026: $8.5bn Loaded, No Buyers in China
Markets · Jul 3, 2026

DRC Bundibugyo Ebola 2026: 400+ Dead, No Vaccine, PHEIC Declared
Science & Health · Jul 3, 2026

Blackstone Sells $7.8bn Virginia Data Centers in 2026 — Top Signal?
Markets · Jul 3, 2026

Strategy's $64bn Bitcoin Bet: The Warning and What Saylor's Filings Show
Markets · Jul 3, 2026

Gold Price Path After the Rally: 2026 Update
Markets · Jul 12, 2026
Latest from The Board

AI Speaks One Language—That's the Real Risk
Technology · Jul 14, 2026

Gematria Sports Dates Selection Bias Explained 2026
Policy & Intelligence · Jul 12, 2026

Gladio Stay-Behind Hybrid War 2026: What Still Applies
Defense & Security · Jul 12, 2026
Gold Price Path After the Rally: 2026 Update
Markets · Jul 12, 2026
Kelly Utilization Meaning: Bet Sizing for Prediction Markets
Markets · Jul 11, 2026

Israel-Turkey War Game Analysis: NATO, Escalation Paths, 2026
Defense & Security · Jul 11, 2026

Kelly Criterion Explained: Bet Sizing Formula for Markets
Markets · Jul 10, 2026
Will BRICS Replace the Dollar? A Reality-Check Scorecard (2026)
Markets · Jul 9, 2026