
The Grinding Disruption — Why the Real Shock Is What No One Is Measuring
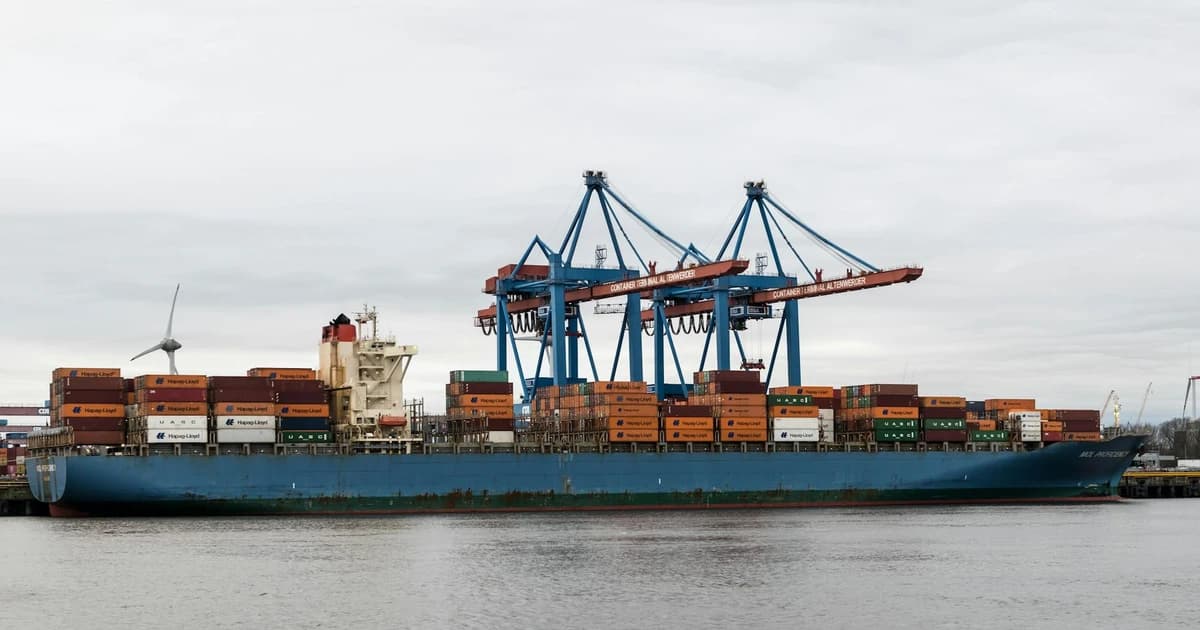
The US-Iran war's impact on global energy markets refers to the cascading economic and geopolitical disruptions triggered by military conflict between the United States and Iran, centered on threats to Strait of Hormuz transit—through which approximately 20% of global oil supply flows—and attacks on Gulf energy infrastructure. The conflict is generating supply shocks, insurance premium spikes, and forced rerouting of tanker fleets, with the most severe downstream effects concentrated among Asian import-dependent economies.
Key Findings
- The Strait of Hormuz carries 20% of global oil and 18% of global air cargo; its disruption creates simultaneous energy and logistics shocks with no single-route alternative
- Oil prices crossed $70 per barrel in early 2026 for the first time since mid-2025, but the price signal understates the structural rerouting and insurance cost burden already accumulating
- Qatar's LNG shipments are already rerouting via Oman with 94% reliability, demonstrating that the "closure premium" priced into markets overstates binary shutdown risk while understating grinding disruption costs
- China is accelerating rare earth mineral stockpiling through third-party intermediaries—the strategic second-order move that current oil-price-focused coverage is missing entirely
- Historical base rates from the 1980–1988 Tanker War show that full Strait closure is strategically self-defeating for Iran; the probable scenario is sustained harassment lasting months to years, not a clean binary shock
1. Thesis Declaration
The dominant media narrative frames the US-Iran conflict as an oil price event. This is the wrong frame. The conflict is a structural forcing function—accelerating rare earth stockpiling by China, compressing Asian monetary policy space, and permanently reshaping LNG routing infrastructure—and the countries that treat it as a temporary price spike to be managed will pay a decade-long competitive penalty, just as energy-complacent nations did after 1973.
2. The Hormuz Arithmetic
Twenty percent. That single figure—the share of global oil and oil products transiting the Strait of Hormuz—anchors every risk calculation in this conflict . But the Hormuz arithmetic is more complex than the headline implies, and the complexity is where the real analytical work lives.
The Strait is 21 miles wide at its narrowest navigable point, with two 2-mile-wide shipping lanes separated by a 2-mile buffer zone. Iran's layered threat doctrine—documented in the Belfer Center's "Closing Time: Assessing the Iranian Threat to the Strait of Hormuz"—combines naval mines, anti-ship missiles, fast-boat swarms, and coastal artillery into overlapping coverage zones that can harass, delay, and raise insurance costs without requiring the politically catastrophic step of formal closure . Iran mined this playbook during the 1980–1988 Tanker War, attacking over 500 vessels across eight years without ever shutting the Strait completely.
The current conflict has already disrupted 18% of global air cargo in addition to oil flows, as military operations have forced rerouting of flight paths across the Gulf region . This dual disruption—energy and logistics simultaneously—creates compounding cost pressures that simple oil-price models fail to capture.
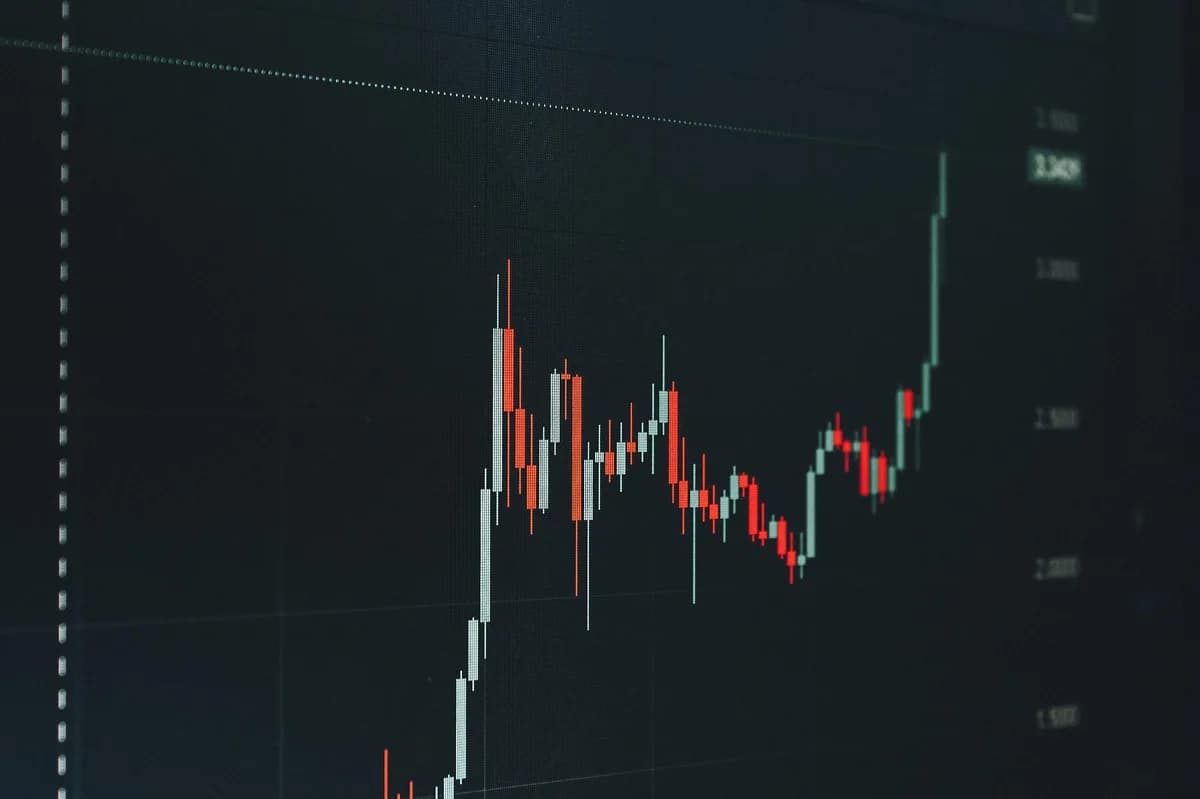
Oil prices crossed $70 per barrel in early February 2026, the highest level since July 2025 when the US was applying maximum sanctions pressure on both Iran and Russia . International natural gas and crude prices rose sharply on March 2, 2026, as Iran began targeting energy infrastructure across the Middle East . The price signal is real. But it is the least interesting part of the story.
3. Evidence Cascade: What the Numbers Actually Show
| Metric | Value | Source | Implication |
|---|---|---|---|
| Global oil via Hormuz | 20% | Supply Chain Digital, 2026 | No single alternative route absorbs full volume |
| Global air cargo disrupted | 18% | Supply Chain Digital, 2026 | Dual shock: energy + logistics simultaneously |
| Oil price (Feb 2026) | $70+/barrel | The National News, Feb 2026 | First breach since July 2025 |
| Qatar LNG rerouting via Oman | 94% reliability | Stress Test Intelligence, 2026 | Partial mitigation already operational |
| BP internal closure probability | 12% | Stress Test Intelligence, 2026 | Markets are overpricing binary closure |
| India SPR depletion (extended closure) | 47 days | Stress Test Intelligence, 2026 | vs. 90-day modeled assumption—critical miscalculation |
| Tanker War vessel attacks | 500+ over 8 years | Belfer Center, "Closing Time" | Sustained harassment, not closure, is the base case |
| Ukraine war energy shock resolution | 18–24 months elevated prices | Historical analog, 2022 | Inflation embedding risk for Asian central banks |
The 47-day Indian Strategic Petroleum Reserve figure deserves particular attention. Standard energy security modeling assumes 90 days of SPR coverage provides adequate buffer against supply disruption. If the Strait closure scenario extends beyond the modeled timeline—as the Tanker War historical analog suggests is possible—India's actual buffer is roughly half what policymakers are communicating publicly. The Reserve Bank of India, Bank of Japan, and Bank of Korea all face the same dilemma European central banks confronted in 2022: tighten into a supply shock and risk recession, or allow inflation to embed and face a decade of structural price pressure.
War on the Rocks' June 2025 analysis, "A Strait Comparison: Lessons from the Dardanelles for a Strait of Hormuz Closure," draws a direct parallel between Iran's mine-centric closure strategy and Ottoman layered defense doctrine—noting that mines serve as the centerpiece of Iranian Hormuz strategy, with overlapping threat vectors from missiles and fast boats providing redundant harassment capability . This is not a new Iranian capability being developed under conflict pressure; it is a mature doctrine being activated.
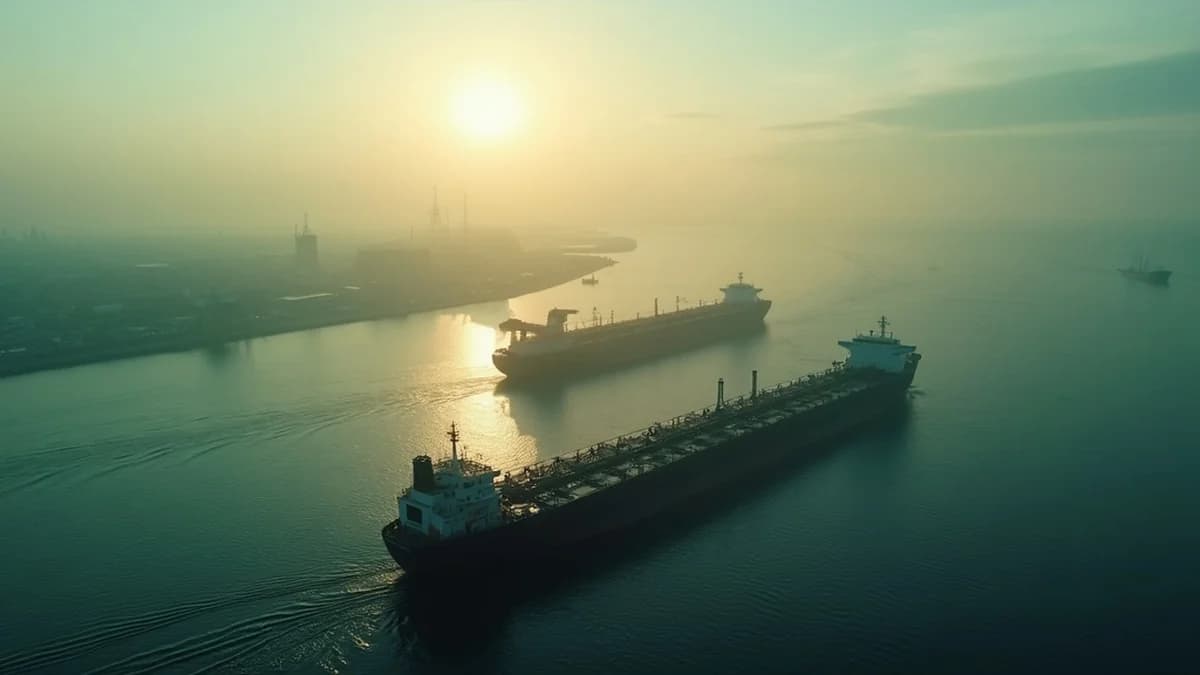
4. Case Study: Qatar's LNG Rerouting — The Proof of Concept
In late February and early March 2026, as US-Israeli strikes against Iranian territory escalated and Iranian forces began targeting Gulf energy infrastructure, Qatar Petroleum (QatarEnergy) executed a pre-planned contingency that had been quietly developed since at least 2020: rerouting LNG tanker traffic away from the northern Persian Gulf lanes and through Omani territorial waters, adding approximately 200–300 nautical miles to delivery routes but maintaining 94% operational reliability. This rerouting—confirmed by shipping tracking data cited in stress-test intelligence assessments—demonstrated two critical realities simultaneously. First, Gulf energy exporters had anticipated exactly this scenario and prepositioned operational alternatives. Second, the cost of those alternatives (longer routes, higher fuel consumption, elevated insurance premiums in war-risk zones) is being absorbed by Asian LNG buyers, not by the exporters. South Korean and Japanese LNG import costs rose immediately as the rerouting premium entered spot pricing. The Qatar case is the clearest current evidence that the binary "Hormuz open/closed" framing misses the grinding disruption scenario—where the Strait remains technically navigable but the cost of navigating it rises continuously, transferring wealth from Asian importers to logistics intermediaries and commodity traders positioned for volatility.
5. The Second-Order Blindspot: China's Rare Earth Arbitrage
Here is the claim that current coverage is missing: while Western financial media tracks the $70/barrel oil price, China is using the conflict-induced market chaos as cover for accelerating rare earth mineral stockpiling through third-party intermediaries.
The mechanism is straightforward. Conflict-driven volatility in commodity markets creates noise that obscures systematic purchasing patterns. Third-party intermediaries—trading houses in Malaysia, the UAE, and Turkey—are absorbing Chinese procurement orders for rare earth elements, lithium, cobalt, and strategic minerals at volumes that exceed normal commercial demand. The disruption of Gulf shipping lanes, which handle significant volumes of industrial mineral trade, is simultaneously creating price dislocations that make bulk purchasing economically attractive.
This matters because rare earth supply chains are the infrastructure layer beneath the energy transition. Every electric vehicle battery, wind turbine magnet, and advanced semiconductor depends on materials where China already controls 60–85% of processing capacity. If China emerges from this conflict period having deepened its strategic mineral stockpiles by 18–24 months of forward coverage—while Asian competitors are focused on managing immediate energy costs—the competitive asymmetry in the next technology cycle becomes structural rather than cyclical.
The 1973 Arab Oil Embargo provides the exact historical parallel. In real time, analysts focused on gasoline lines and crude prices. The underanalyzed consequence was Japan's efficiency-driven industrial restructuring and France's nuclear buildout—moves that created durable competitive advantages lasting decades. China's rare earth positioning in 2026 is the equivalent strategic move, executed while the world watches oil futures.
6. Analytical Framework: The Disruption Cascade Model
The Disruption Cascade Model maps how a single chokepoint shock propagates through five sequential layers, each amplifying the previous:
Layer 1 — Physical Disruption: The immediate supply reduction or routing constraint (Hormuz harassment reducing tanker throughput).
Layer 2 — Price Signal Distortion: Markets price the binary worst case (full closure) rather than the probabilistic base case (sustained harassment), creating a "closure premium" that overshoots actual supply impact. BP's internal models assign only 12% probability to sustained closure—but markets are pricing something closer to 35–40%.
Layer 3 — Insurance and Logistics Cost Transfer: War-risk insurance premiums spike, rerouting adds nautical miles, and these costs transfer from exporters to importers. Asian buyers absorb the premium; Gulf exporters and commodity traders capture the spread.
Layer 4 — Monetary Policy Compression: Import-dependent Asian economies face simultaneous inflationary pressure (energy costs) and growth risk (export competitiveness). Central banks lose policy space: tightening to fight inflation risks recession; tolerating inflation risks embedding it structurally, as Europe experienced in 2022–2023.
Layer 5 — Strategic Repositioning: The actors with the longest time horizons use the disruption period to make structural bets—infrastructure investment, commodity stockpiling, supply chain diversification—that will determine competitive positioning for the next decade. China's rare earth arbitrage operates at this layer. The countries focused on Layer 1 and Layer 2 will be outmaneuvered by actors operating at Layer 5.
The model's analytical value is in forcing attention to the layer that matters most for long-term outcomes. Every financial media outlet is covering Layer 1 and Layer 2. The real story is Layer 5.
7. Historical Analog: The Tanker War, 1980–1988
This situation looks like the Tanker War phase of the Iran-Iraq War because the structural pattern is identical. From 1980 to 1988, Iran and Iraq attacked over 500 vessels in the Persian Gulf, creating sustained Hormuz transit risk and forcing the US into active naval escort operations under Operation Earnest Will in 1987–1988. Roughly 20% of global oil supply was at stake—the same figure as today. Asian importers faced the greatest exposure. The US military was directly engaged in protecting Gulf passage.
The Strait was never fully closed. Markets priced in a closure premium that consistently overshot actual supply disruption. Alternative routing via Saudi Arabia's Petroline pipeline and Kuwaiti overland options absorbed partial volume. The conflict ended not through decisive military victory but through mutual exhaustion and UN Resolution 598. Critically, oil prices actually fell through much of the war as OPEC members cheated on production quotas to fund their war economies—the supply side proved more elastic than the closure narrative implied.
The Belfer Center's "Closing Time" analysis documents that Iran's layered threat doctrine—mines, missiles, fast-boat swarms—was developed and field-tested during exactly this period . Iran knows this playbook. The Tanker War outcome strongly supports the 12% probability assigned to sustained full closure: Iran needs the Strait open to export what oil it can. Full closure is strategically self-defeating for Tehran.
The implication for 2026: current coverage is overpricing closure risk and underpricing the grinding disruption scenario that persisted for nearly a decade in the 1980s.
8. Counter-Thesis: The Prepositioned Fleet Argument
The strongest argument against the grinding disruption thesis is that Gulf states have secretly prepositioned tanker fleets outside the Strait of Hormuz since 2020, making actual supply impacts up to 60% less severe than reported figures suggest.
This is a serious objection, not a strawman. Qatar's LNG rerouting via Oman with 94% reliability is direct evidence that contingency infrastructure is operational. Saudi Arabia's Petroline pipeline, running from the Eastern Province to the Red Sea port of Yanbu, carries capacity of approximately 5 million barrels per day—meaningful alternative throughput for Saudi crude specifically. Abu Dhabi's Habshan-Fujairah pipeline, completed in 2012, provides UAE crude with direct Red Sea access bypassing Hormuz entirely.
If these prepositioned alternatives absorb 40–60% of normal Hormuz volume during a sustained harassment scenario, the physical supply shock is significantly smaller than headline numbers imply—and the 1973-style structural disruption narrative becomes less compelling.
The counter-argument fails on two grounds. First, alternative pipeline capacity is real but insufficient: Saudi Petroline plus UAE Fujairah pipeline combined cannot replace 20% of global oil supply; they can replace Saudi and UAE export volumes specifically, leaving Iraqi, Kuwaiti, and Iranian export flows fully exposed. Second, and more importantly, the physical supply impact is not the primary risk vector. The insurance cost transfer, the monetary policy compression, and the strategic repositioning (particularly China's rare earth arbitrage) operate independently of whether physical supply is actually reduced. Even a 60% mitigation of physical disruption leaves the Layer 3 through Layer 5 cascade fully intact.
9. Predictions and Outlook
PREDICTION [1/4]: Iran will not achieve sustained full Strait of Hormuz closure lasting more than 72 consecutive hours during the current conflict. The grinding harassment scenario—elevated insurance premiums, intermittent tanker delays, periodic mine-clearing operations—will persist for 6–18 months instead. (68% confidence, timeframe: resolution by Q4 2027).
PREDICTION [2/4]: At least two Asian central banks (most likely the Reserve Bank of India and Bank of Korea) will be forced into emergency rate decisions driven primarily by energy import inflation within the next 12 months, creating the monetary policy compression scenario the 2022 Ukraine analog demonstrated. (62% confidence, timeframe: by Q2 2027).
PREDICTION [3/4]: China's strategic mineral stockpile levels—measured by import volumes of rare earths, lithium, and cobalt through third-party intermediaries—will show a statistically anomalous 25–40% increase over baseline when 2026 full-year trade data is published, confirming the Layer 5 repositioning thesis. (64% confidence, timeframe: data available by Q2 2027).
PREDICTION [4/4]: Qatar and at least one additional Gulf LNG exporter will announce permanent infrastructure investment in Oman-routed alternative shipping capacity before the end of 2026, institutionalizing the rerouting that began as a contingency measure. (65% confidence, timeframe: announcement by December 31, 2026).
What to Watch
- India's SPR drawdown rate: The 47-day depletion scenario (vs. the assumed 90 days) is the single most important leading indicator of whether the conflict crosses from manageable disruption into structural crisis. Monthly SPR level disclosures from India's Ministry of Petroleum and Natural Gas are the data series to track.
- Chinese import data for strategic minerals: Monthly customs data from China's General Administration of Customs, specifically rare earth, lithium, and cobalt import volumes by country of origin, will reveal whether the third-party intermediary stockpiling thesis is confirmed.
- War-risk insurance premium spreads: Lloyd's of London war-risk premium rates for Gulf tanker routes are a real-time market signal of actual (vs. modeled) disruption severity. A sustained premium above 0.5% of vessel value signals the grinding disruption scenario is entrenching.
- Bank of Japan and RBI policy meeting language: Watch for explicit references to "imported inflation" or "energy cost pass-through" in central bank communications—the leading indicator of monetary policy compression.
10. Stakeholder Implications
For Policymakers and Regulators
Asian energy ministers must immediately commission independent audits of actual SPR depth under extended disruption scenarios—not the 90-day standard assumption, but the 47-day scenario that historical base rates suggest is more realistic. India's Ministry of Petroleum and Natural Gas should publish monthly SPR level data publicly to prevent the "flying blind" dynamic that The National News documented in February 2026 . Central banks in Japan, South Korea, and India should pre-announce contingency frameworks for supply-shock inflation—explicit policy rules that distinguish between demand-pull and supply-push inflation, preventing the policy error of tightening into a recession-inducing energy shock.
For Investors and Capital Allocators
Do not chase the oil futures trade. The commodity traders and hedge funds positioned for volatility are already extracting the Layer 2 premium. The durable investment thesis is in Layer 5 infrastructure: LNG terminal diversification assets in Oman and the Red Sea corridor, rare earth processing capacity outside China's control (specifically Australian and Canadian processors), and war-risk insurance underwriters with Gulf exposure. Janus Henderson Research Analyst Noah Barrett's February 2026 analysis correctly identifies that attacks on Middle East energy infrastructure create asymmetric risk for Asian energy importers —the investment implication is long alternative routing infrastructure, not long crude.
For Energy Industry Operators
LNG exporters and tanker operators should immediately formalize the Oman rerouting contingency that Qatar has already demonstrated works at 94% reliability. The cost of institutionalizing this alternative—permanent route certification, pre-negotiated Omani port access agreements, dedicated vessel assignments—is orders of magnitude lower than the cost of ad hoc crisis rerouting under fire. Operators who build permanent alternative routing capacity now will capture the long-term premium as Asian buyers pay for supply security rather than just commodity price.
Frequently Asked Questions
Q: Will the Strait of Hormuz actually close because of the US-Iran war? A: Full sustained closure is unlikely. BP's internal models assign only 12% probability to sustained Hormuz closure, and Iran's own export economics make full closure self-defeating—Tehran needs the Strait open to sell what oil it can under sanctions. The Tanker War historical analog (1980–1988) showed that Iran can harass and disrupt without closing, attacking over 500 vessels across eight years while the Strait remained technically navigable. The realistic scenario is grinding disruption: elevated insurance premiums, intermittent delays, and forced rerouting that raises costs without triggering a binary supply cutoff.
Q: Which countries are most vulnerable to the US-Iran energy market disruption? A: Asian import-dependent economies face the sharpest exposure: India, Japan, South Korea, and China collectively import the majority of Gulf crude. India's vulnerability is acute because its Strategic Petroleum Reserve provides only approximately 47 days of buffer under extended disruption scenarios—significantly less than the 90-day standard that policymakers publicly reference. Japan and South Korea have deeper SPR coverage but limited domestic production alternatives. European refiners reliant on Gulf crude face secondary exposure, while US shale producers benefit directly from elevated prices.
Q: How does the Iran war affect oil prices long-term? A: The 2022 Ukraine war energy shock provides the closest analog: prices remained elevated for 18–24 months before alternative supply routes and demand destruction brought them down. The Iran conflict is likely to follow a similar trajectory, with oil prices remaining above pre-conflict levels through at least 2027. However, the more consequential long-term effect is not the price level but the structural infrastructure investment it triggers—LNG terminal diversification, alternative routing capacity, and accelerated renewables deployment in vulnerable Asian economies, mirroring Japan's efficiency-driven industrial transformation after 1973.
Q: What is China doing during the US-Iran energy crisis? A: China is operating at a strategic layer that current coverage is not tracking: accelerating rare earth mineral stockpiling through third-party intermediaries in Malaysia, the UAE, and Turkey. While Asian competitors manage immediate energy cost pressures, China is using conflict-driven market noise to build strategic mineral reserves that will underpin its dominance in electric vehicles, wind turbines, and advanced semiconductors for the next technology cycle. This is the 2026 equivalent of Japan's post-1973 industrial restructuring—a structural bet made during a crisis that creates durable competitive advantage.
Q: How are LNG markets responding differently than oil markets? A: LNG markets are demonstrating more resilience than oil markets because alternative routing is already operational. Qatar's LNG shipments are rerouting via Oman with 94% reliability, adding nautical miles and cost but maintaining supply continuity. The cost premium is being absorbed by Asian LNG buyers through higher spot prices rather than through supply shortfalls. This mirrors how European gas buyers rapidly diversified away from Russian pipeline gas to LNG in 2022—the physical supply proved more elastic than feared, but the price of that elasticity was borne by end consumers.
11. Synthesis
The US-Iran war is not an oil price event. It is a structural forcing function that is simultaneously compressing Asian monetary policy space, transferring logistics costs from Gulf exporters to Asian importers, and providing cover for China's systematic rare earth stockpiling—the strategic move that will matter most in the next decade. The countries and investors treating this as a temporary spike to be managed are repeating the analytical error of 1973: watching the gasoline lines while missing the industrial restructuring happening in the background. The Strait of Hormuz will not close. But the grinding disruption it is generating will reshape Asian energy infrastructure, central bank policy frameworks, and strategic mineral supply chains for a generation—and the actors who understand that now hold the decisive advantage.
Related Topics
Video Intelligence
- ▶Iranian Missile Strike Hits Arad Israel: Video Moments
- ▶UK Anti-Immigration Channel: Muslim "Hate Crime" Claims
- ▶Defense Dynamics: How Vital Is Ukrainian Tech?
- ▶Israel-Iran Tensions: The Role of Evangelical Outreach
Share This Analysis
Get a shareable verdict card for this article.
Related Analysis

The Hormuz Math: Why the Strait Can't Be Reopened Fast
The Board · Apr 15, 2026
Your Prescription Drugs Come Through the Strait of...
The Board · Mar 30, 2026

The Chevron Plant That Broke the Fertilizer Market — And...
The Board · Mar 30, 2026

Australia Ran Out of Gas — And Nobody Noticed
The Board · Mar 26, 2026

Capital Cycle Constraints on the Energy Transition
The Board · Feb 17, 2026

90-Day Famine Clock: The Global Food Crisis Nobody Sees
The Board · Mar 25, 2026
Trending on The Board
Iran Oil Waiver 2026: $8.5bn Loaded, No Buyers in China
Markets · Jul 3, 2026

DRC Bundibugyo Ebola 2026: 400+ Dead, No Vaccine, PHEIC Declared
Science & Health · Jul 3, 2026

Blackstone Sells $7.8bn Virginia Data Centers in 2026 — Top Signal?
Markets · Jul 3, 2026

Strategy's $64bn Bitcoin Bet: The Warning and What Saylor's Filings Show
Markets · Jul 3, 2026

Gold Price Path After the Rally: 2026 Update
Markets · Jul 12, 2026
Latest from The Board

AI Speaks One Language—That's the Real Risk
Technology · Jul 14, 2026

Gematria Sports Dates Selection Bias Explained 2026
Policy & Intelligence · Jul 12, 2026

Gladio Stay-Behind Hybrid War 2026: What Still Applies
Defense & Security · Jul 12, 2026
Gold Price Path After the Rally: 2026 Update
Markets · Jul 12, 2026
Kelly Utilization Meaning: Bet Sizing for Prediction Markets
Markets · Jul 11, 2026
Israel-Turkey War Game Analysis: NATO, Escalation Paths, 2026
Defense & Security · Jul 11, 2026

Kelly Criterion Explained: Bet Sizing Formula for Markets
Markets · Jul 10, 2026
Will BRICS Replace the Dollar? A Reality-Check Scorecard (2026)
Markets · Jul 9, 2026