
Executive Summary
The IMF's reported 16 t net central-bank gold purchase in Q1 2026 (F1) sits far below the World Gold Council's OTC-derived estimate of ≈ 244 t (F2), a 15-fold gap that feeds bullish price assumptions, including J.P. Morgan's $6,000/oz target (F11). China accelerated its gold buying to 8 t in April 2026 (F4), with 317 t in net imports in Q1 2026 (F5), read as a strategic hedge against dollar-asset risk (F6). A sharp downward revision by Metals Focus to 57 t (F14) and uncertainty over the Fed's rate outlook (F12) are real headwinds to that bullish case.
1. The hidden gold surge: uncovering the true central-bank demand gap
The IMF's voluntary reporting captured only 16 t of net central-bank purchases in Q1 2026 (F1), while the World Gold Council estimates ≈ 244 t of actual central-bank demand (F2), roughly a 15-fold discrepancy. That gap matters because central-bank buying drives the "safe-haven" narrative underpinning forward-looking price models; without the "missing" 228 t, the market has no clear catalyst for a sustained rally toward $6,000/oz.
Board analysis: a voluntary-reporting regime this porous benefits sovereigns who would rather not signal a shift away from dollar reserves, though no sourced Kremlin or Beijing statement makes that claim directly.
2. Strategic hedge or geopolitical signal? China's gold accumulation
The People's Bank of China increased its monthly buying rate from 1 t to 8 t in April 2026 (F4), with 317 t of net gold imports in Q1 2026 (F5). Analysts link the surge to a hedge against dollar-denominated risk, citing the 2022 US freeze of Russian central-bank reserves (F6), a shift already visible in China's H1 764-tonne gold import haul, tracked in our central-bank gold reserves coverage, and part of the same broader dollar-hedging pattern behind the petrodollar-war thesis. Chinese consumer bar-and-coin demand surged 67% YoY to a record 207 t in Q1 2026 (F7), and ten major insurers were approved to allocate up to 1% of assets to physical gold, potentially adding 200 t of demand (F8). No sourced Chinese state-media commentary on the PBOC's pace change is available; the trade and import data stand on their own (F4, F5).
3. Gold is rallying against its own textbook driver
Here is the part that should not be happening. The 10-year TIPS real yield, gold's single most-cited price driver because gold pays no yield of its own, sat at 2.68% as of September 16, 2026 (F16), historically elevated territory. Textbook macro says a real yield that high should be crushing gold, not sitting underneath a run toward $6,000/oz. It isn't.
At the same time, CFTC data show commercial traders, the bullion banks and hedgers who typically sit on the other side of speculative bets, net short 264,370 gold futures contracts as of September 8, 2026: 94,401 long against 358,771 short (F17). Positioning this lopsided on the commercial side usually means speculative money is just as lopsided long on the other side of the book (F18), a textbook signature of a rally running hot on paper positioning, not only physical accumulation. COMEX's own gold vaults held 27.4 million troy ounces combined as of September 16, 2026, 55.3% of it registered for delivery (F19); iShares' IAU gold ETF alone carried $64.6 billion in net assets the next day (F20).
None of this proves the rally is fake. It proves the opposite of what the official 16-tonne number implies: real yields say sell, futures positioning says the paper market is crowded, and gold is still pricing toward $6,000 anyway. Something is absorbing that pressure that the public data doesn't show, and it lines up with the same 228-tonne gap this piece opened with.
4. Market modeling and price targets
J.P. Morgan targets $6,000/oz by Q4 2026 and $6,300/oz by end-2027, with a full-year 2026 average of $5,243/oz (F11), assuming sustained large central-bank buying. Gold traded at $4,216/oz as of June 12, 2026 (F13), implying roughly a 42% upside to that target. Gregory Shearer called gold "stuck in a bit of a technical no-man's land" because of Fed rate uncertainty (F12).
5. Quantitative headwinds: revision and Fed uncertainty
Metals Focus revised its Q1 2026 central-bank demand estimate from 244 t down to 57 t (F14), a sign of potentially weaker demand than first thought. Fed rate uncertainty, per Shearer's comment (F12), adds volatility to price projections and could shrink the "safe-haven" premium.
6. Perspective lenses
Beijing: no sourced Chinese state-media reaction is available; the accumulation itself is documented (F4). Analysts see it as a hedge against dollar-asset risk post-2022 (F6).
Moscow / Global-South: no sourced reaction is available.
Market: J.P. Morgan's $6,000/oz target relies on the 244 t central-bank demand estimate (F11), while Metals Focus's revision to 57 t is a real counterweight (F14). The current spot price is $4,216/oz (F13), with technical uncertainty tied to Fed policy (F12). Commercial futures positioning is near-record net short (F17) while the 10-year real yield sits at 2.68% (F16), a combination that should be bearish and isn't.
Adversarial: no sourced reaction is available.
Conclusion
Q1 2026 gold demand shows a stark gap between official reporting (16 t) and OTC-derived estimates (≈ 244 t), and that gap is doing real work in the bullish forecasts. China's accelerated buying is both a strategic hedge and a driver of the hidden-demand story, but Metals Focus's downward revision to 57 t and Fed rate uncertainty are real headwinds against it. The market's own textbook driver, real yields, argues gold should be falling, not rallying, and commercial futures positioning shows a paper market already leaning heavily short against it. Both should be capping the price. Neither is. Until the voluntary reporting regime changes or more transparent data emerges, the gold market stays shaped by activity central banks aren't required to disclose.
Key takeaways
- The IMF's reported 16 t of Q1 2026 central-bank gold buying is roughly 15 times below the World Gold Council's OTC-derived estimate of 244 t (F1, F2).
- China's net gold imports hit 317 t in Q1 2026, and its consumer bar-and-coin demand hit a record 207 t, both read as a hedge against dollar-asset risk (F5, F7).
- Metals Focus's revision of central-bank demand down to 57 t is a real headwind to J.P. Morgan's $6,000/oz target, which assumes the buying holds (F11, F14).
- The 10-year real yield (2.68%) and a near-record-short commercial futures book both argue gold should be weaker than it is, not stronger (F16, F17).
Related Analysis
- Central Banks Turned Gold Sellers. One Country Did It.
- Silver Deficit 2026: BofA's $300 Target Explained
- Gold Price Forecast 2026: $10,000 Call vs $4,500 Banks
- Bitcoin $100K in 2026? The Money Says 1-in-5
- China Imported 764 Tons of Gold in Six Months
- Trump's Iran Demands: Unconditional Surrender Analysis
- The Future of Global Energy and AI Power Demand
- Gladio Stay-Behind Hybrid War 2026: What Still Applies
Related Topics
Video Intelligence
- ▶Iranian Missile Strike Hits Arad Israel: Video Moments
- ▶Iran Releases Official Footage of Drone Launches During War
- ▶Iranian Kamikaze Drone Destroys Erbil Oil Refinery
- ▶FPV Drone Strikes US Victoria Base Near Baghdad Airport
Share This Analysis
Get a shareable verdict card for this article.
Get the next one first
Free briefings when we publish major outlooks and forecasts. No spam — unsubscribe anytime.
Related Analysis

2026 Economic Crisis: Why Central Banks May Fail
The Board · Feb 22, 2026

Copper Price Forecast 2029-2031: Supply vs Green Demand
The Board · Feb 22, 2026

US Inflation Outlook and Fed Interest Rate Strategy
The Board · Feb 20, 2026

Will AI Replace White-Collar Jobs in 10 Years
The Board · Feb 22, 2026
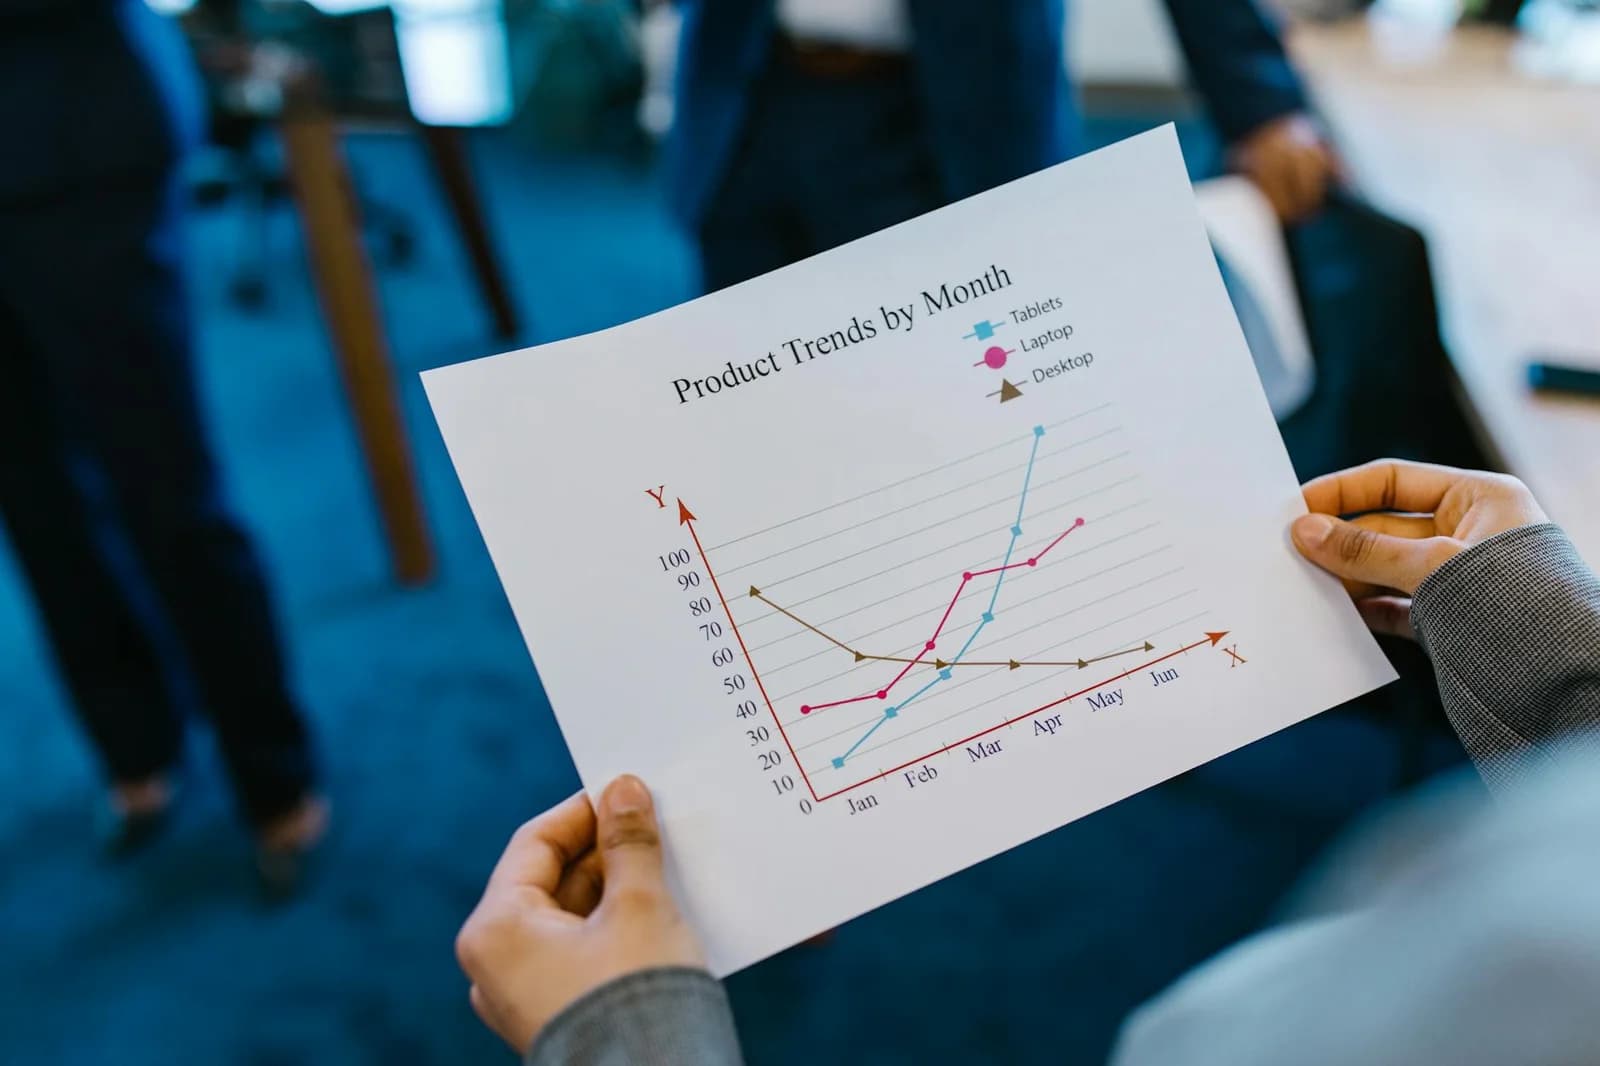
When to Hire a VP of Sales vs Investing in PLG
The Board · Feb 22, 2026
ECB Rate Strategy Amid US Tariffs and Eurozone Inflation
The Board · Feb 22, 2026
Trending on The Board

Houthis Take Perim as Saudis Halt Pipeline 2026
Geopolitics · Sep 13, 2026
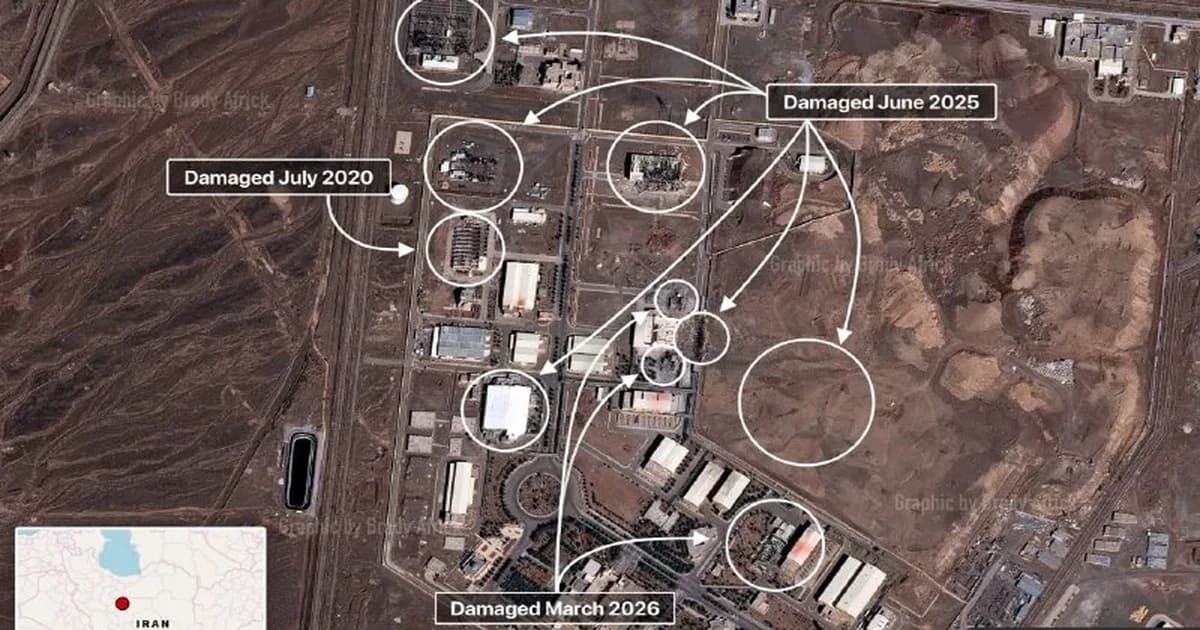
What Israel-Iran War Games Got Wrong About 2026
Defense & Security · Sep 6, 2026

Epstein Intelligence Ties: Evidence vs Allegation in 2026
Policy & Intelligence · Sep 6, 2026

China Imported 764 Tons of Gold in Six Months
Markets · Aug 20, 2026

The 'Muslim NATO' Fails Its First Test in 48 Hours
Geopolitics · Aug 27, 2026
Latest from The Board
Houthis Take Perim as Saudis Halt Pipeline 2026
Geopolitics · Sep 13, 2026
Epstein Intelligence Ties: Evidence vs Allegation in 2026
Policy & Intelligence · Sep 6, 2026
What Israel-Iran War Games Got Wrong About 2026
Defense & Security · Sep 6, 2026

Central Banks Turned Gold Sellers. One Country Did It.
Markets · Aug 30, 2026

Schiff vs Saylor vs the Banks: Who Got 2026 Right?
Predictions · Aug 27, 2026

Silver Deficit 2026: BofA's $300 Target Explained
Markets · Aug 27, 2026

Iran War Scenarios After the 60-Day Deadline Expires
Geopolitics · Aug 27, 2026
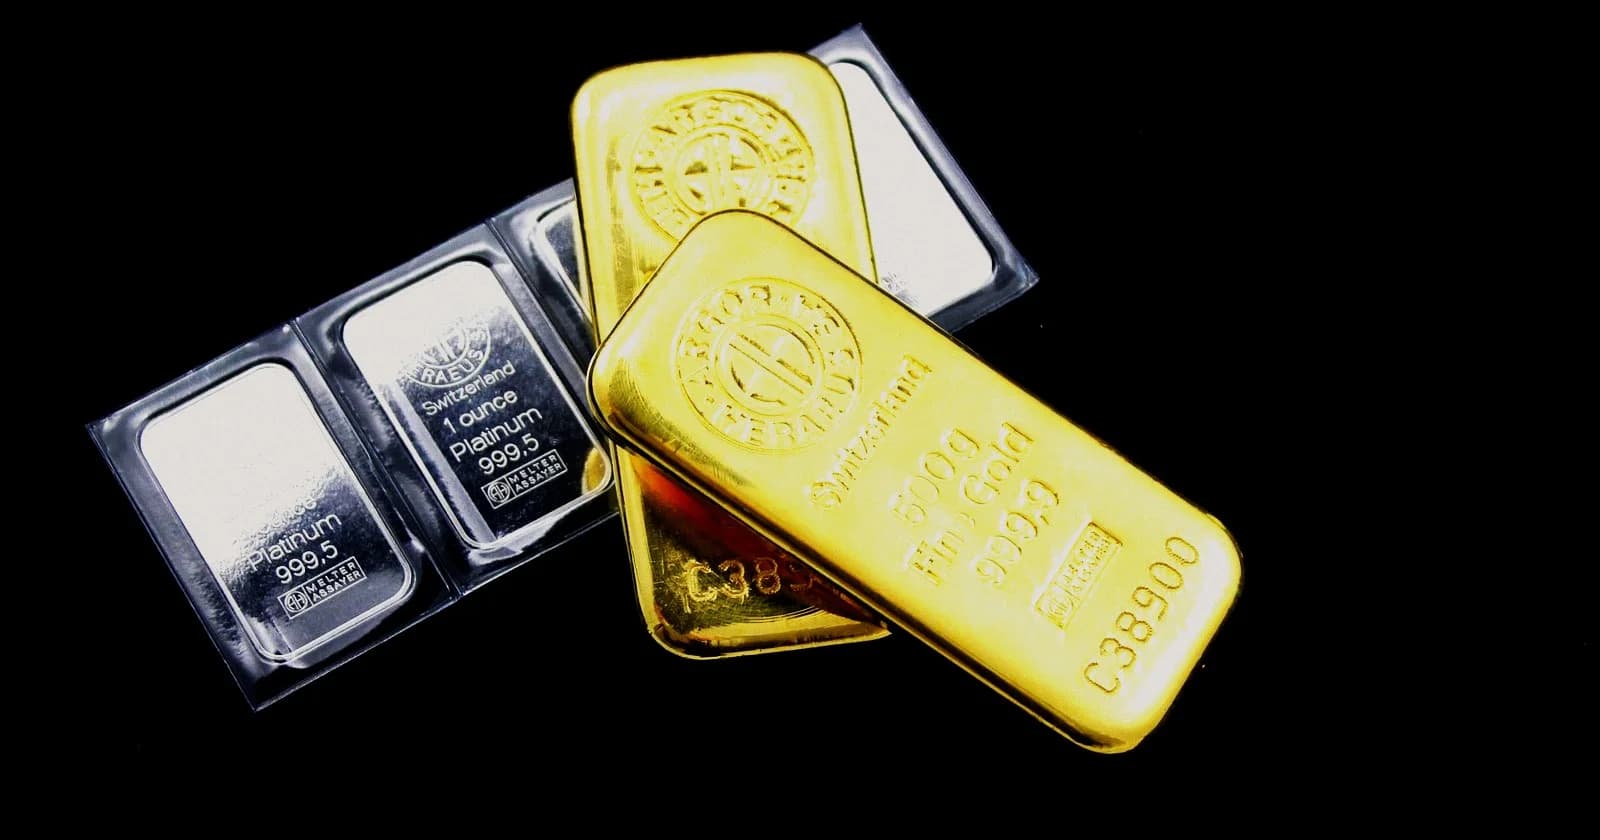
Gold Price Forecast 2026: $10,000 Call vs $4,500 Banks
Markets · Aug 27, 2026