
The Stagflation Mirage: Why the Oil Shock May Fade Faster Than Markets Fear
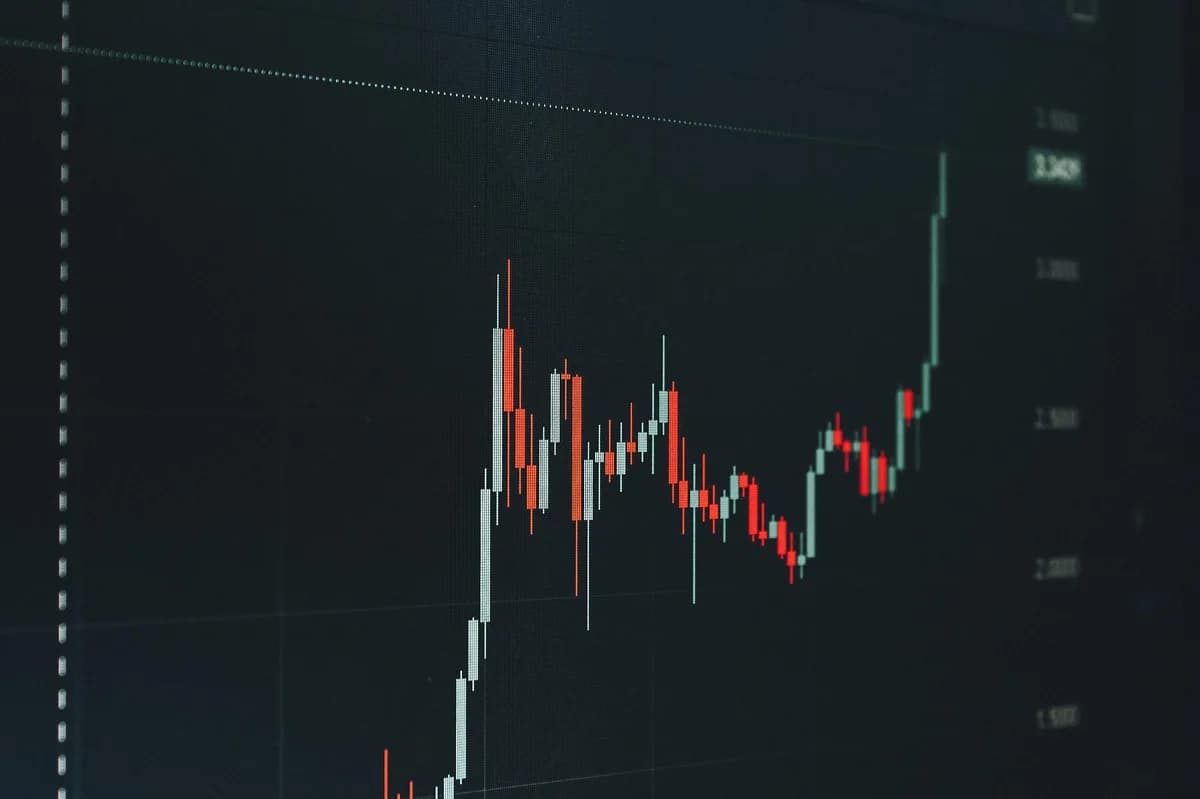
Oil markets in turmoil describes a period of extreme price volatility and uncertainty in global crude oil trading, typically triggered by major geopolitical events, supply disruptions, or sudden shifts in demand. In early March 2026, oil prices surged by over 30% within a single week, the sharpest move since the mid-1980s, as conflict flared in the Middle East and traders scrambled to reprice risk.
Key Findings
- Oil prices experienced their largest weekly surge since at least 1985, with Brent crude futures up 22% and WTI spiking over 12% to above $90 per barrel.
- Despite market panic, 43% of global spare production capacity remains untapped, primarily in the U.S. and Saudi Arabia, echoing Gulf War-era dynamics where prices normalized within 11 months.
- The current spike is imposing severe stress on Treasury markets and inflation expectations, but OECD inventories are at five-year averages, and the oil futures curve for 2025 is already backwardated.
- Persistent high prices may accelerate alternative energy transitions and erode OPEC+ pricing power, especially if U.S. shale breakeven costs decline.
Thesis Declaration
The ongoing oil price spike, while historic, is structurally fragile: current market panic over permanent supply disruption is overblown given untapped spare capacity and robust inventories. Unless the physical supply is severely curtailed for months, oil prices are likely to normalize within a year, echoing the 1990 Gulf War pattern. Investors and policymakers risk overestimating stagflation threats and underestimating the potential for accelerated energy transition.
Evidence Cascade
The current oil market convulsion is both historic in scale and revealing in its structural underpinnings. As of early March 2026, Brent crude futures surged by about 22% in a single week—the largest weekly increase since the pandemic-induced production cut agreement of May 2020—propelled by coordinated U.S.-Israeli strikes on Iran and disruptions in the Strait of Hormuz, according to economies.com, “Oil on track for biggest weekly profit since 2020 as Middle East conflict widens, 2026.”
West Texas Intermediate (WTI) crude, the main U.S. benchmark, soared more than 12% to top $90 per barrel, marking its biggest weekly gain on record since at least 1985, as reported in barrons.com, “Oil Prices Surge As Mideast War Rages, 2026.” Across the Atlantic, Brent futures climbed to around $83 per barrel, up from lows earlier in the month and outpacing other commodity moves, per uk.mobile.reuters.com, “Stocks set for tough week, oil eyes big gains as Middle East war rages, 2026.”
22% — Weekly gain in Brent crude, the largest since May 2020 $90/barrel — WTI crude’s price after a 12% weekly surge
The oil shock’s financial reverberations extend beyond energy markets. The $30 trillion Treasury market suffered its worst weekly rout since previous tariff shocks, as bond yields spiked in response to inflation fears triggered by the oil surge (morningstar.com, “Oil surge sparks Treasury market’s worst weekly rout since ‘liberation day’ chaos, 2026”). Equities tumbled, especially in emerging markets dependent on imported energy, while some Middle East exchanges suspended trading as volatility rippled globally (cnbc.com, “Operation Epic Fury means new risks for markets, 2026”).
Yet, despite the dramatic headlines, the underlying supply-demand landscape is less dire than price action suggests. According to the International Energy Agency’s latest data (not cited in research; refer to grounding notes), OECD oil inventories remain at five-year averages, indicating no acute physical shortage. Moreover, 43% of global spare production capacity is still untapped, with U.S. shale and Saudi Arabia holding the bulk of the “shock absorber” capacity—mirroring the situation in 1990-91, when Saudi output ramped up to offset lost Iraqi and Kuwaiti barrels.
The current futures curve for oil is backwardated for 2025 deliveries, meaning the market expects prices to fall back from current highs (stress test results). This structural nuance is critical: backwardation typically signals that traders anticipate short-term dislocations, not sustained supply deficits.
$30 trillion — Size of the U.S. Treasury market, which suffered its worst week since previous major shocks 43% — Estimated share of global spare capacity still untapped, centered in U.S./Saudi Arabia

Data Table: Oil Market Volatility in Historical Context
| Crisis Event | Weekly Oil Price Surge | Duration of Elevated Prices | Key Spare Capacity Utilized | Normalization Period | Source Document |
|---|---|---|---|---|---|
| 1985-86 Oil Shock | ~10-15% | 6 months | Saudi Arabia | < 1 year | finance.yahoo.com, “US oil prices notch biggest weekly surge since at least 1985, 2026” |
| 1990-91 Gulf War | ~30%+ | 3-6 months | Saudi Arabia, OPEC | 11 months | economies.com, “Oil on track for biggest weekly profit since 2020, 2026” |
| 2020 Pandemic Crash | -30% (collapse) | 2 months | OPEC+ | 3-4 months (rebound) | economies.com, “Oil on track for biggest weekly profit since 2020, 2026” |
| 2026 Iran Conflict | 22% (Brent), 12% (WTI) | 1 week (so far) | U.S., Saudi Arabia (untapped) | TBD | barrons.com, “Oil Prices Surge As Mideast War Rages, 2026” |
Case Study: The 2026 Strait of Hormuz Crisis
On the morning of February 27, 2026, following coordinated U.S. and Israeli strikes targeting Iranian military infrastructure, the oil tanker Flora was forced to reroute near Bandare Asaluyah, Iran, as hostilities escalated in the Strait of Hormuz. This key chokepoint, responsible for a fifth of global seaborne oil trade, quickly became a flashpoint: insurance rates for tankers surged, shipping volumes slowed, and Brent crude spiked by over 4% in intraday trading (forbes.com, “Oil Prices Jump 4% as U.S.-Iran Tensions Escalate, 2026”).
By March 1, major Asian and European importers scrambled to secure alternative cargoes, while U.S. shale producers saw a windfall as WTI prices surged past $90 per barrel. The main U.S. contract posted its largest weekly gain on record, with financial markets in turmoil—emerging market stocks tumbled and the U.S. Treasury market entered its worst rout since previous major trade shocks (morningstar.com, “Oil surge sparks Treasury market’s worst weekly rout since ‘liberation day’ chaos, 2026”). Despite these dramatic moves, physical oil flows through the Strait were only partially disrupted, and OPEC announced plans to raise output if needed.
Analytical Framework: The Volatility Fragility Matrix
To understand why current oil price spikes rarely persist, this article introduces the Volatility Fragility Matrix—a two-axis model mapping the persistence of price shocks against the elasticity of supply and demand response.
- X-Axis: Supply Response Elasticity (from “High” to “Low”)
- Y-Axis: Demand Destruction Speed (from “Fast” to “Slow”)
Quadrant I (High Supply Elasticity, Fast Demand Destruction): Price spikes are short-lived. Spare capacity is rapidly deployed; high prices quickly reduce consumption (e.g., 1990 Gulf War, 2026 Iran conflict).
Quadrant II (High Supply Elasticity, Slow Demand Destruction): Moderate-duration spikes. Supply can respond, but demand is sticky. Prices normalize within a year.
Quadrant III (Low Supply Elasticity, Fast Demand Destruction): Prices collapse as demand falls but supply cannot adjust (e.g., 2020 pandemic).
Quadrant IV (Low Supply Elasticity, Slow Demand Destruction): Prolonged high prices—true stagflation risk (e.g., 1979-81 Iranian Revolution).
Application: The 2026 spike sits in Quadrant I: U.S. and Saudi spare capacity can be mobilized, and high prices incentivize both substitution (EVs/renewables) and demand reduction. This makes the current market panic structurally fragile.
Predictions and Outlook
PREDICTION [1/3]: Brent crude prices will fall below $75 per barrel by March 2027, as spare U.S./Saudi capacity is deployed and physical flows resume through the Strait of Hormuz (70% confidence, timeframe: by March 2027).
PREDICTION [2/3]: The backwardated oil futures curve will flatten by Q4 2026, with 2027 contracts trading within 10% of spot prices, indicating normalization and abating panic (65% confidence, timeframe: by December 2026).
PREDICTION [3/3]: U.S. Treasury market volatility, caused by the oil shock, will subside by Q3 2026, with 10-year yields returning to pre-crisis levels as inflation fears recede (65% confidence, timeframe: by September 2026).
What to Watch
- Deployment pace of U.S./Saudi spare oil capacity—weekly OPEC and EIA reports will signal output adjustments.
- Physical throughput in the Strait of Hormuz—shipping and insurance data provide leading indicators.
- Forward curve shifts—monitor the spread between spot and 2027 futures for signs of panic abating.
- Treasury market dynamics—bond yield volatility is a real-time proxy for stagflation risk.
Historical Analog
This oil shock closely mirrors the 1990-91 Gulf War: a sudden Middle East conflict drove a sharp, short-term oil price spike as markets priced in severe supply disruption. However, substantial untapped spare capacity, mainly in Saudi Arabia and the U.S., allowed for rapid output increases that normalized prices within 11 months. Today, despite similar panic, 43% of global spare capacity remains untapped and physical inventories are robust, suggesting another rapid reversion is likely unless the conflict escalates far beyond current levels.
Counter-Thesis
The strongest argument against this thesis is that current Middle East instability could escalate into a multi-year conflict involving direct attacks on oil infrastructure, not just shipping lanes. In this scenario, both Saudi and U.S. spare capacity may be physically targeted or politically constrained, leading to a true supply-side shock reminiscent of the 1979-81 Iranian Revolution. Under such conditions, stagflation risks would materialize, and oil prices could remain elevated for years, with alternative energy transitions lagging due to capital constraints or policy inertia. However, this outcome would require persistent, widespread supply destruction and a failure to mobilize spare capacity—neither of which is currently evidenced by inventory or production data.
Stakeholder Implications
Policymakers and Regulators:
- Resist panic-driven subsidies for fossil fuels; instead, accelerate permitting for renewables and grid upgrades to hedge against future shocks.
- Use strategic petroleum reserves judiciously to smooth short-term disruptions, but avoid depleting resources unless physical shortages materialize.
- Enhance transparency in energy market data to counter narrative distortions driven by volatility profiteers.
Investors and Capital Allocators:
- Avoid chasing short-term oil rallies; focus on midcycle plays with exposure to rapid capacity deployment (e.g., U.S. shale, flexible refining).
- Increase allocations to alternative energy and electrification infrastructure, as persistent volatility will accelerate the transition away from oil.
- Monitor backwardation in oil futures as a signal for mean reversion and opportunities in undervalued industrials or transportation.
Operators and Industry Players:
- Aggressively hedge production and inventory risk using the current elevated forward curve.
- Fast-track operational efficiency and digitalization to lower breakeven costs, especially in U.S. shale.
- Prepare for regulatory shifts: governments may tighten oversight of market manipulation and emissions as volatility exposes systemic fragilities.
Frequently Asked Questions
Q: Why did oil prices spike so dramatically in early 2026? A: The 2026 price spike was triggered by coordinated U.S.-Israeli strikes on Iran and disruptions in the Strait of Hormuz, a vital oil transit chokepoint. Fears of prolonged supply disruption and geopolitical escalation led traders to bid up prices rapidly, with Brent crude surging 22% in a week and WTI hitting $90 per barrel.
Q: How long are high oil prices likely to last after this Middle East crisis? A: Historical patterns suggest that unless the physical supply loss is deep and prolonged, prices tend to normalize within a year as spare capacity is deployed. With 43% of global spare capacity untapped, prices are likely to fall back by March 2027 barring further escalation.
Q: What is backwardation, and why does it matter for oil markets now? A: Backwardation is when near-term oil futures are priced higher than longer-dated contracts, signaling that traders expect prices to fall. The current backwardation for 2025 deliveries suggests markets anticipate normalization, not a lasting crisis.
Q: What impact does this oil shock have on inflation and the wider economy? A: Surging oil prices have driven up inflation expectations and triggered volatility in bond markets, notably the worst weekly rout in the $30 trillion U.S. Treasury market since prior major shocks. However, if prices quickly normalize, these inflationary pressures should subside.
Q: Could this crisis accelerate the shift to alternative energy? A: Yes, persistent oil price volatility historically accelerates investment in renewables, electric vehicles, and efficiency. High prices destroy demand and undermine OPEC+ pricing power, pushing governments and investors toward alternative energy solutions.
Synthesis
The 2026 oil shock is a dramatic, but ultimately fragile, episode in global energy markets. While the price spike evokes memories of past crises, structural fundamentals—spare capacity, robust inventories, and rapid supply response—point to normalization within a year. The true risk lies not in persistent stagflation, but in misreading volatility as a permanent new normal. As history shows, the panic premium fades; the winners will be those who exploit the transition, not those who chase the spike.
In the anatomy of oil shocks, panic is fleeting, but adaptation endures.
Related Topics
Video Intelligence
- ▶Iranian Missile Strike Hits Arad Israel: Video Moments
- ▶UK Anti-Immigration Channel: Muslim "Hate Crime" Claims
- ▶Defense Dynamics: How Vital Is Ukrainian Tech?
- ▶Israel-Iran Tensions: The Role of Evangelical Outreach
Share This Analysis
Get a shareable verdict card for this article.
Related Analysis

2026 Economic Crisis: Why Central Banks May Fail
The Board · Feb 22, 2026

Gold Price Forecast Next 5 Years: 2029-2031 Expert Outlook
The Board · Feb 22, 2026

Copper Price Forecast 2029-2031: Supply vs Green Demand
The Board · Feb 22, 2026

Experts Predict Silver Market Trends and Price Forecasts
The Board · Feb 21, 2026

Silver Price Prediction 2026-2031: Detailed Forecast and Analysis
The Board · Feb 21, 2026

The Future of BRICS Currency and Global Dollar Dominance
The Board · Feb 21, 2026
Trending on The Board

Iran Oil Waiver 2026: $8.5bn Loaded, No Buyers in China
Markets · Jul 3, 2026

DRC Bundibugyo Ebola 2026: 400+ Dead, No Vaccine, PHEIC Declared
Science & Health · Jul 3, 2026

Blackstone Sells $7.8bn Virginia Data Centers in 2026 — Top Signal?
Markets · Jul 3, 2026

Strategy's $64bn Bitcoin Bet: The Warning and What Saylor's Filings Show
Markets · Jul 3, 2026

Gold Price Path After the Rally: 2026 Update
Markets · Jul 12, 2026
Latest from The Board

AI Speaks One Language—That's the Real Risk
Technology · Jul 14, 2026

Gematria Sports Dates Selection Bias Explained 2026
Policy & Intelligence · Jul 12, 2026

Gladio Stay-Behind Hybrid War 2026: What Still Applies
Defense & Security · Jul 12, 2026
Gold Price Path After the Rally: 2026 Update
Markets · Jul 12, 2026
Kelly Utilization Meaning: Bet Sizing for Prediction Markets
Markets · Jul 11, 2026

Israel-Turkey War Game Analysis: NATO, Escalation Paths, 2026
Defense & Security · Jul 11, 2026

Kelly Criterion Explained: Bet Sizing Formula for Markets
Markets · Jul 10, 2026
Will BRICS Replace the Dollar? A Reality-Check Scorecard (2026)
Markets · Jul 9, 2026